 Illustrative data
Illustrative data: every figure, name, and org shown in these screens is fabricated. See the full NDA note below.
Budget tracking dashboards and an AI assistant for Finance Business Partners and org leaders managing spend across Meta.
Illustrative dataIllustrative data: every figure, name, and org shown in these screens is fabricated. See the full NDA note below.
Finance Business Partners (FBPs) and org leaders managed multi-billion-dollar spend across OpEx, headcount, and travel without dedicated tooling, manually stitching together Concur exports, Workday ledgers, and FP&A data in spreadsheets. Budget coverage sat at just 0.2%.
The work came in two parts: build a unified real-time tracking foundation, then layer AI on top of it to answer the routine financial questions that were consuming hours of manual effort.
Give org leaders and their delegates a budget view they can act on themselves, accurate enough to trust and simple enough to use without a finance background, and make it work across every category of spend at Meta.



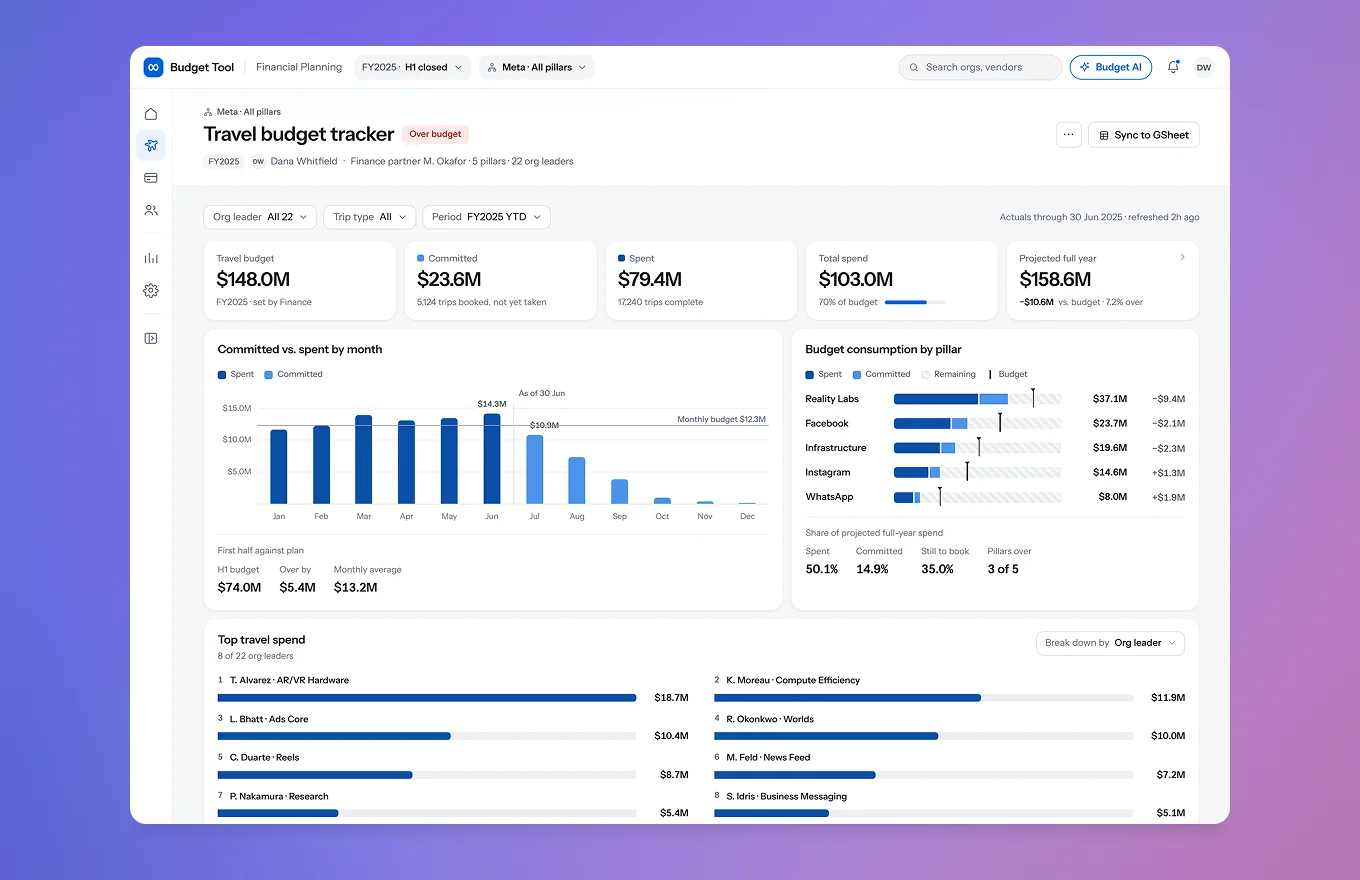
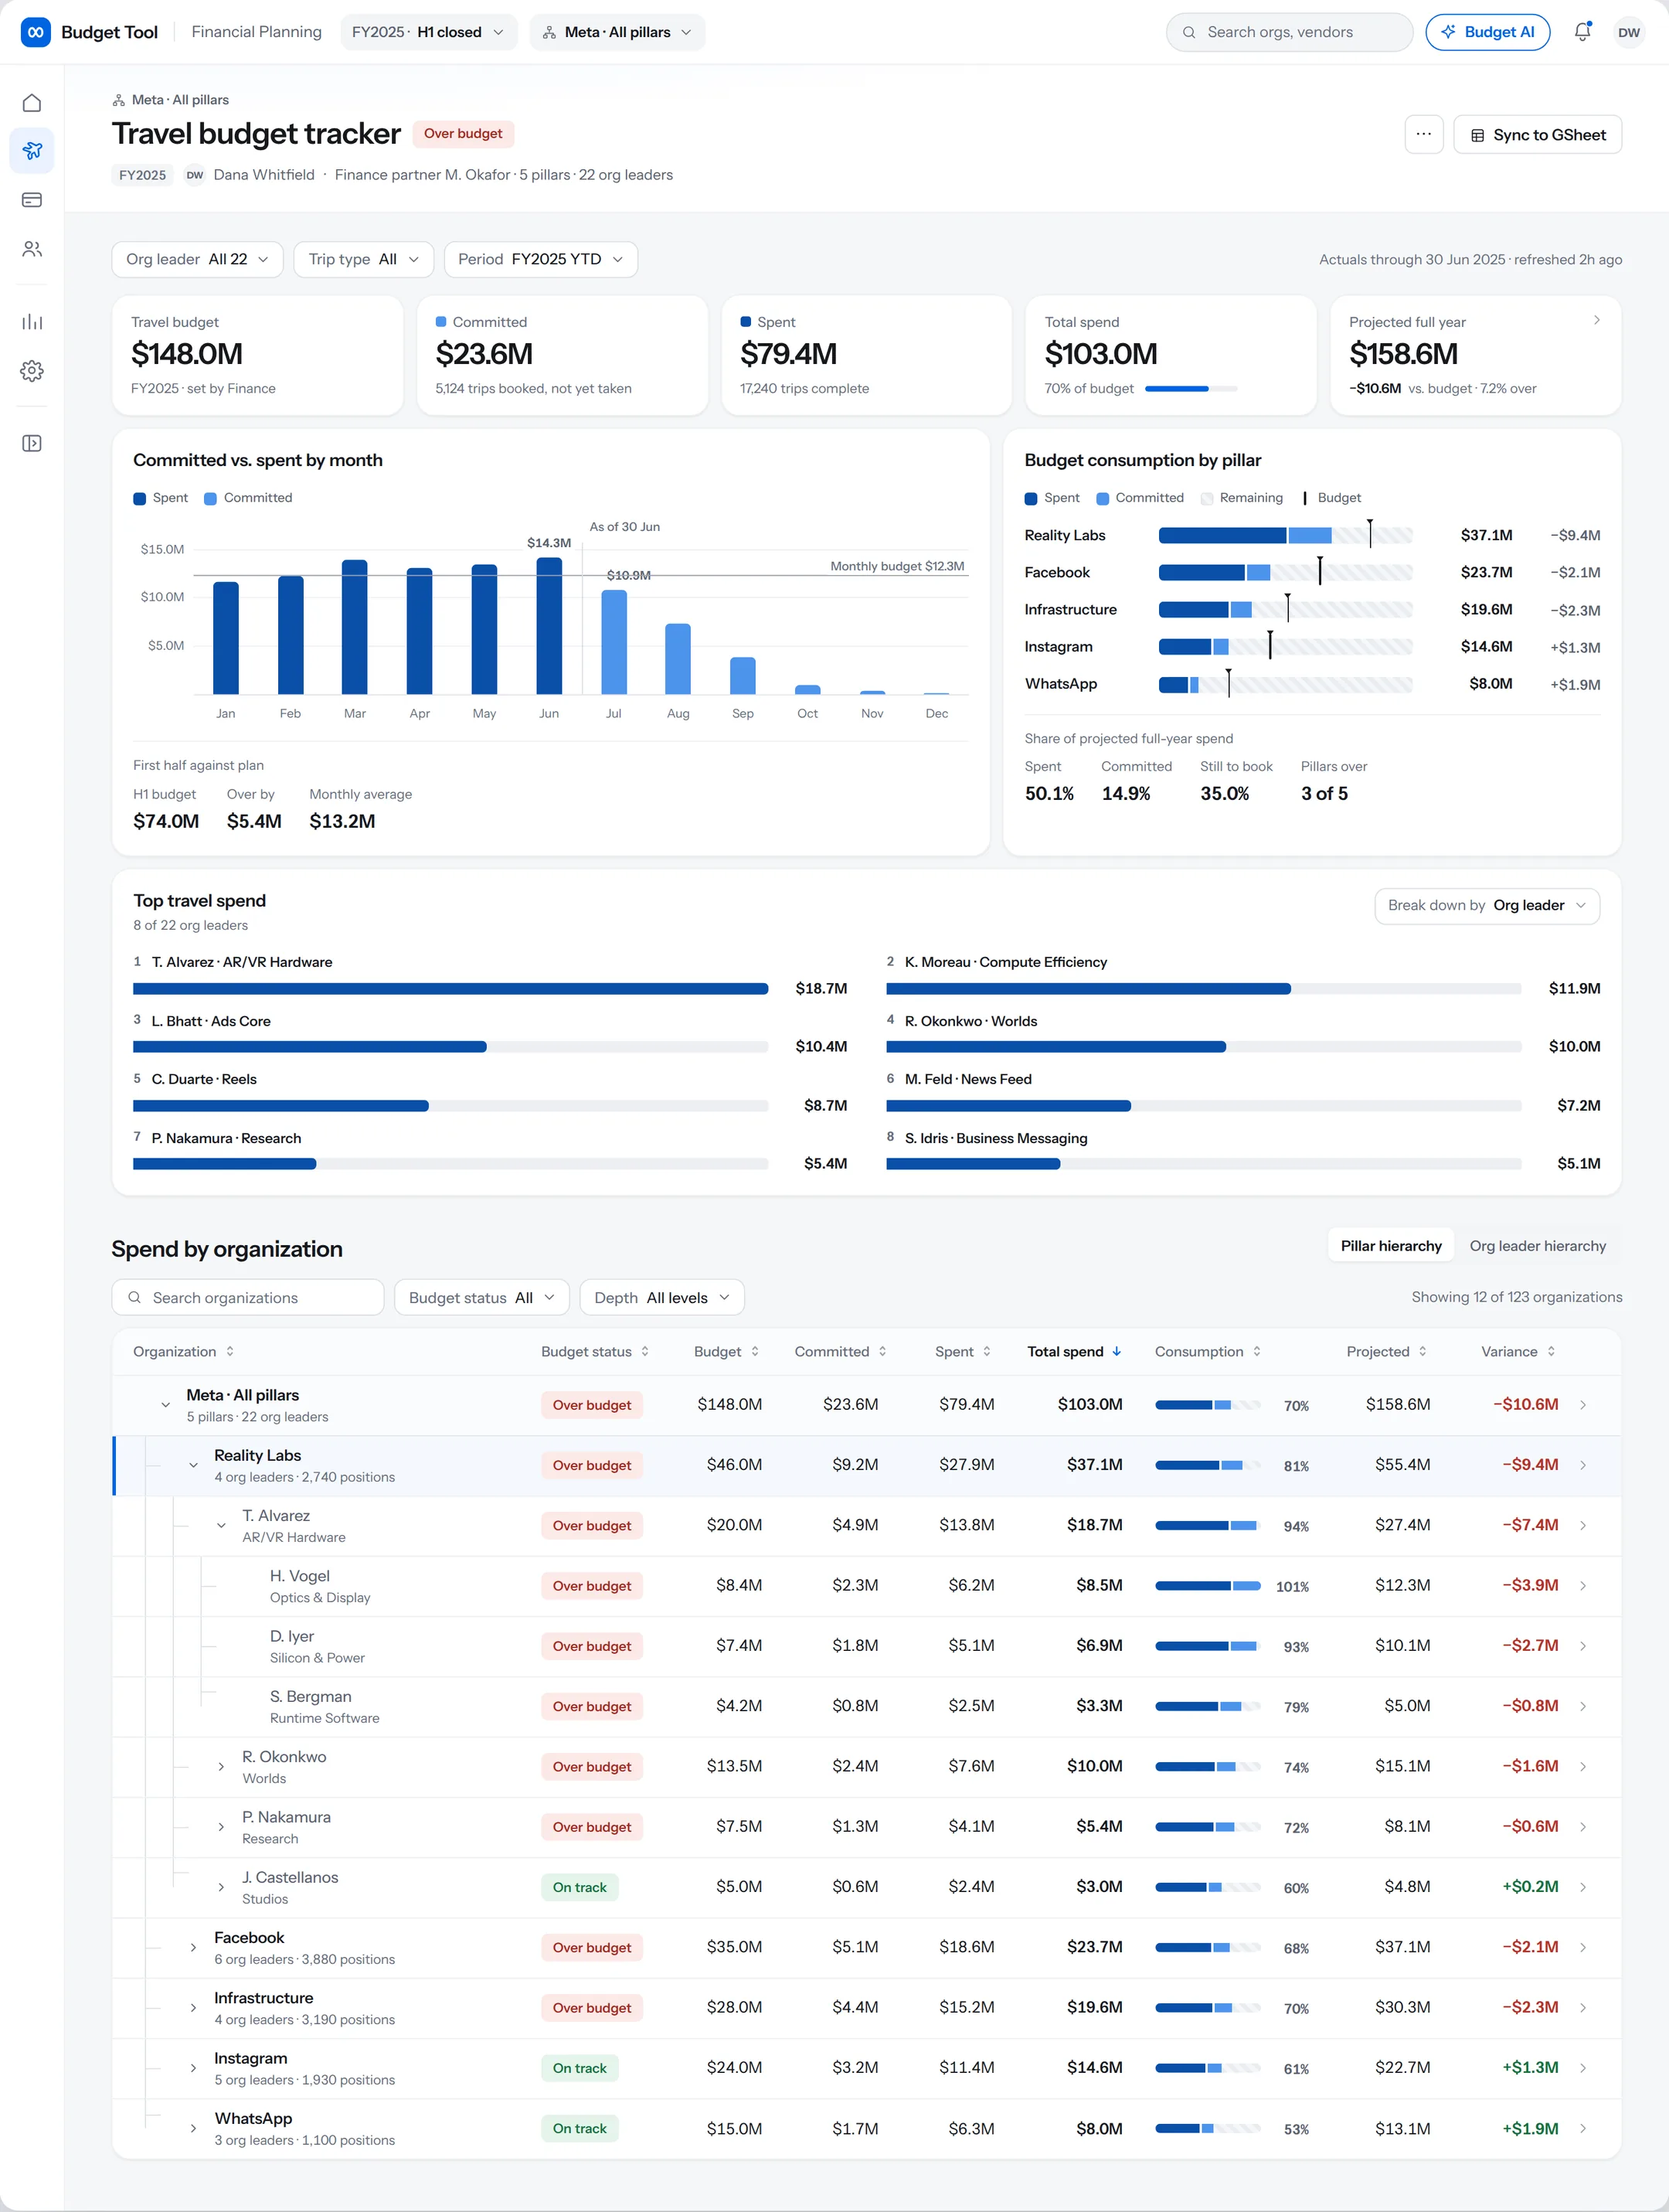
Budget accountability at Meta flowed hierarchically, moving from company-wide down to pillars, org leaders, and individual positions, trips, or purchase orders. I designed every surface to mirror that exact shape.
Whether monitoring the whole company or a single pillar, users operated at different altitudes within the same mental model. That consistency mattered beyond navigation: an AI assistant is only as trustworthy as the structured data underneath it.
Each tracker (Travel, OpEx, Headcount) operated as an independent pod with its own PM, Finance partner, 5 to 7 engineers, and shared UX research support. As the sole consistent design thread across all three, I drove cross-surface consistency in practice.
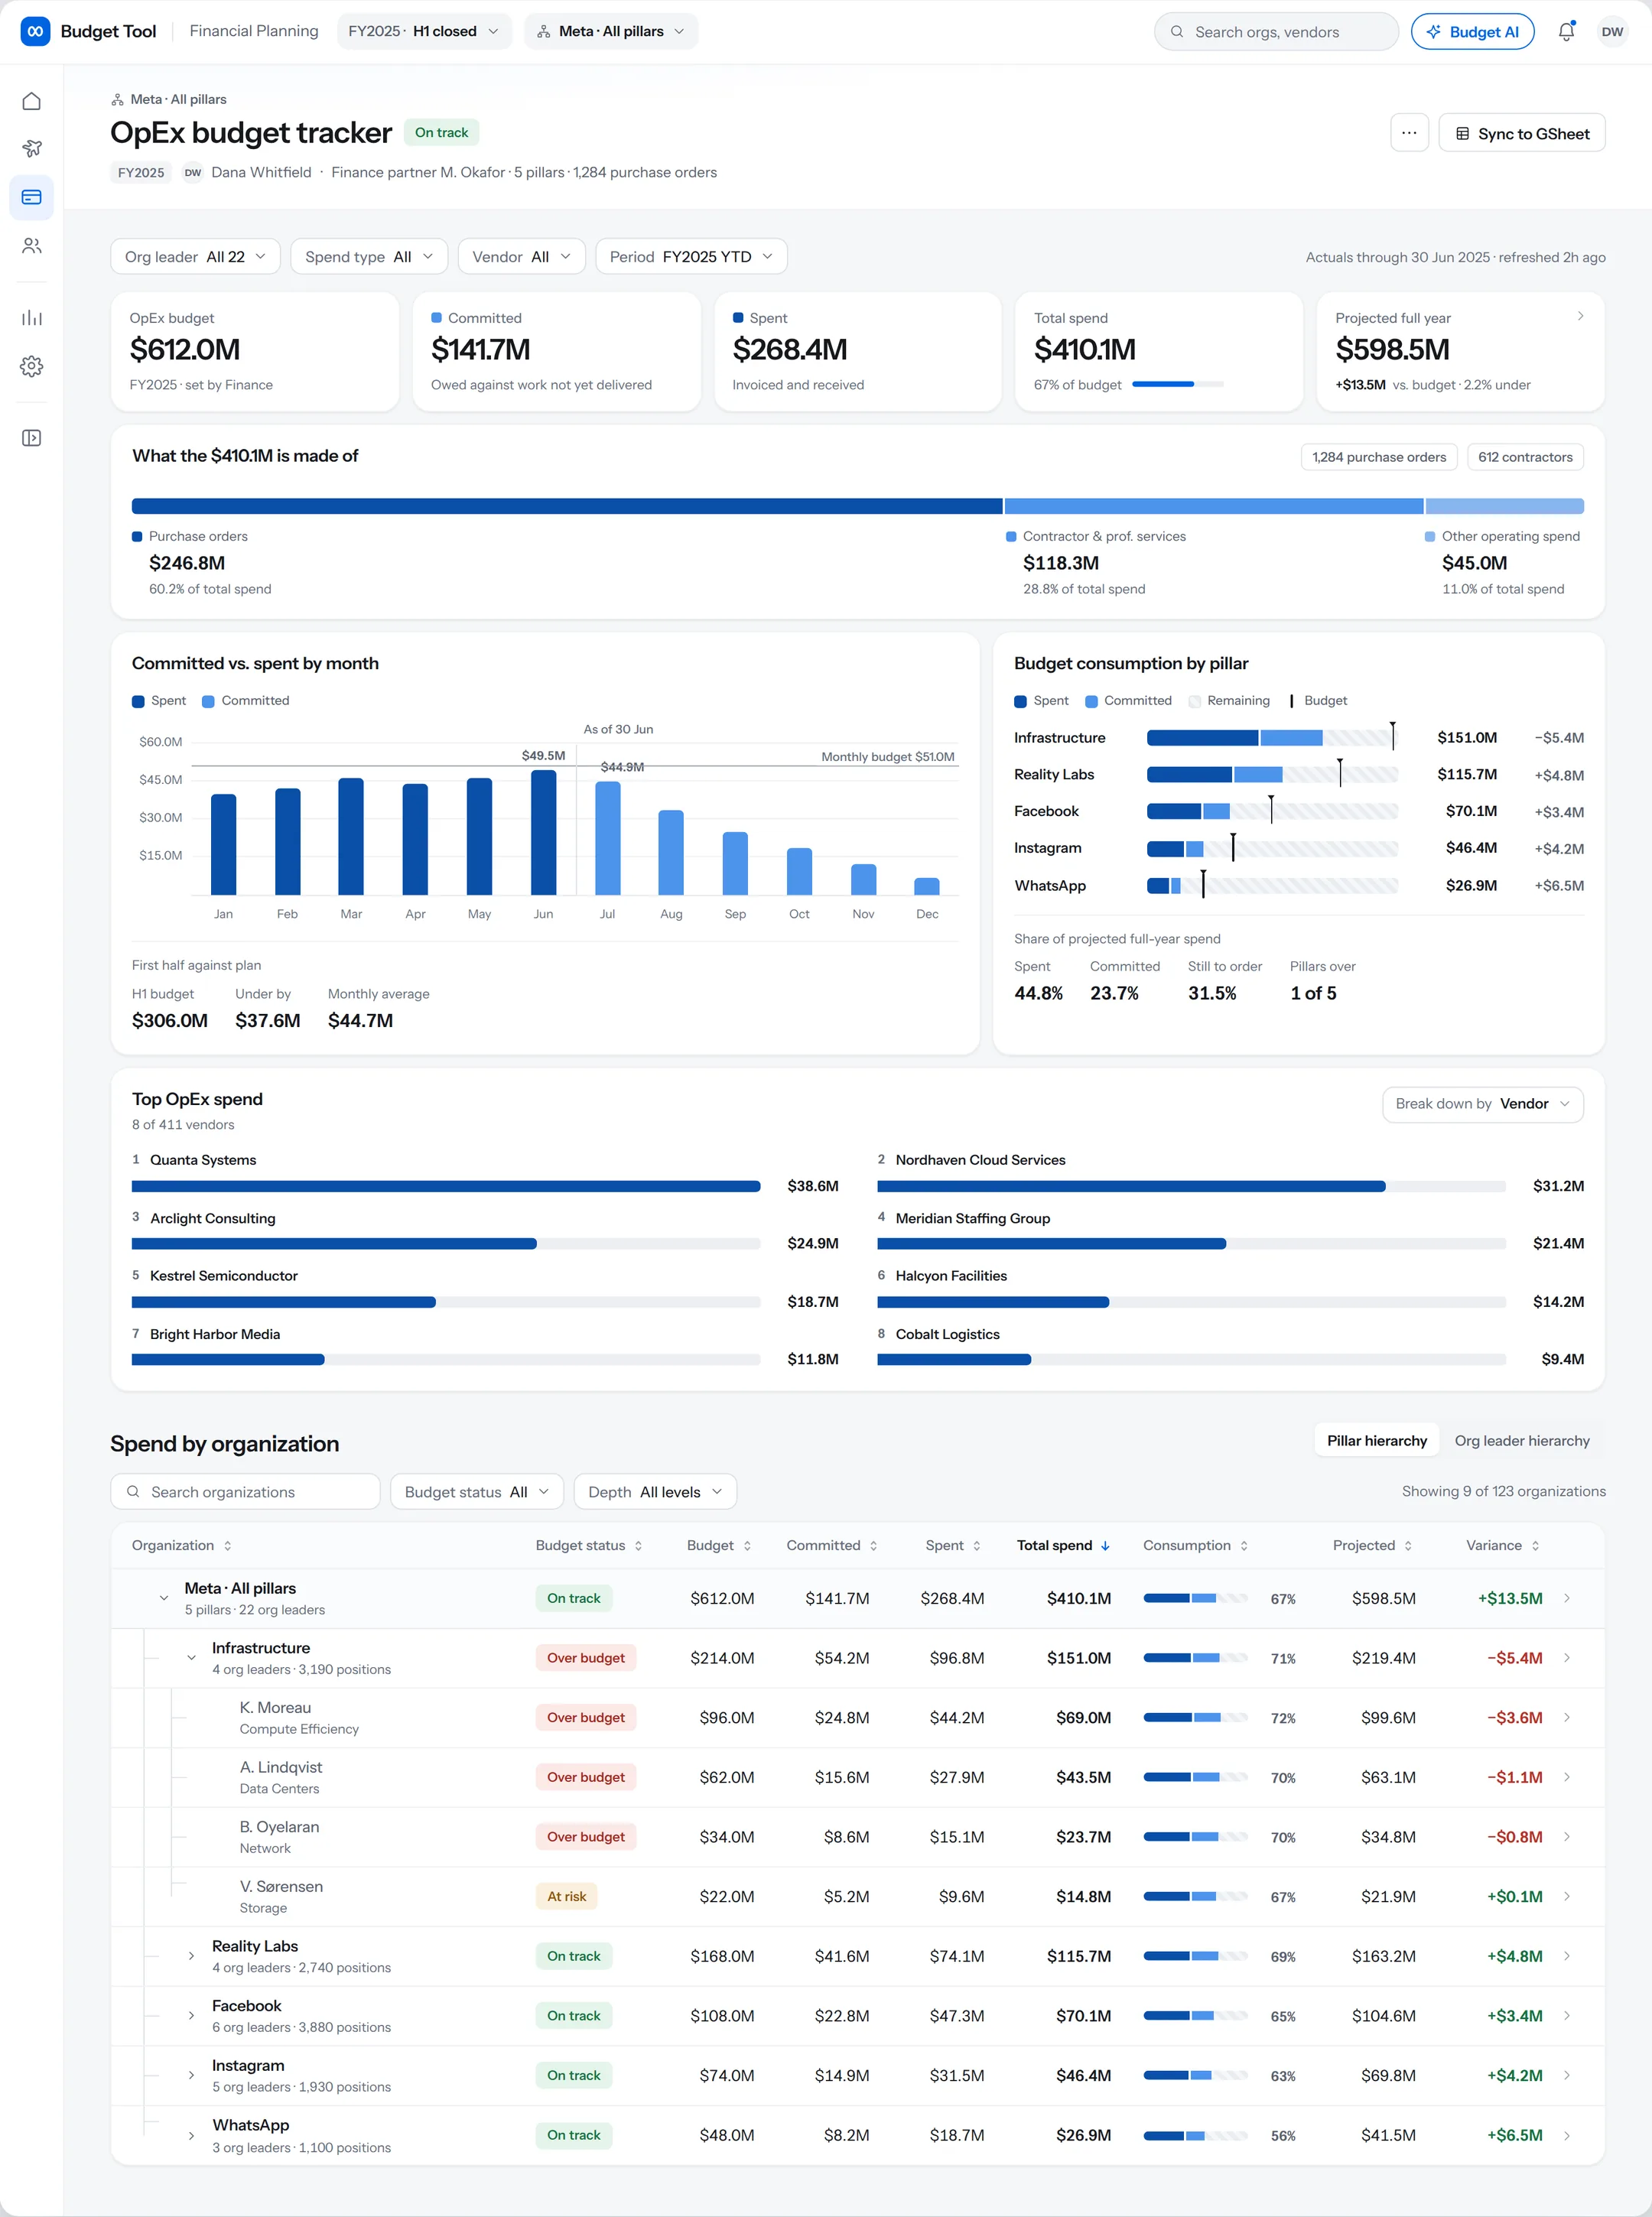
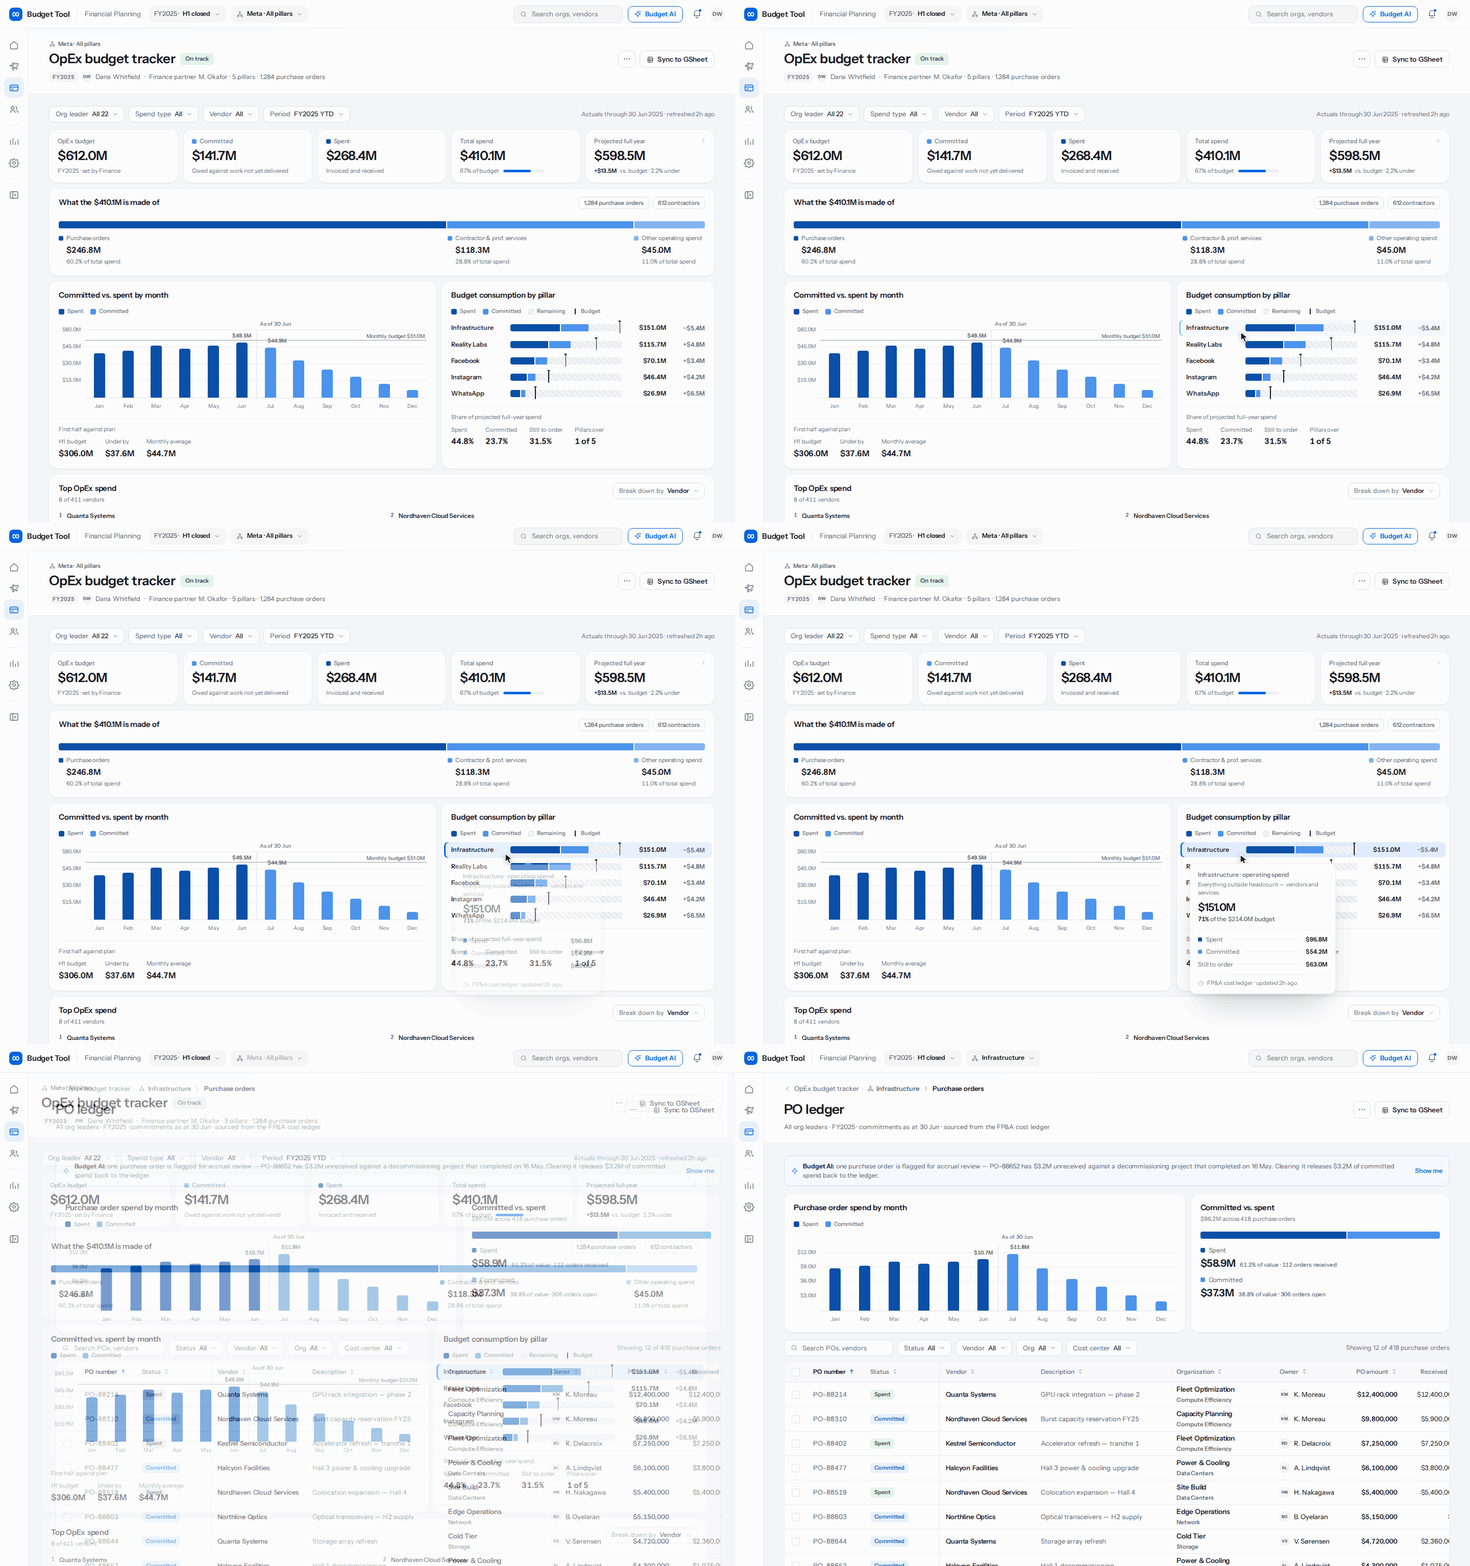
While another designer originated early concepts for Travel and Headcount, I independently designed OpEx from 0 to 1, establishing the component patterns and system foundation used to elevate Travel and Headcount in Phase 2.
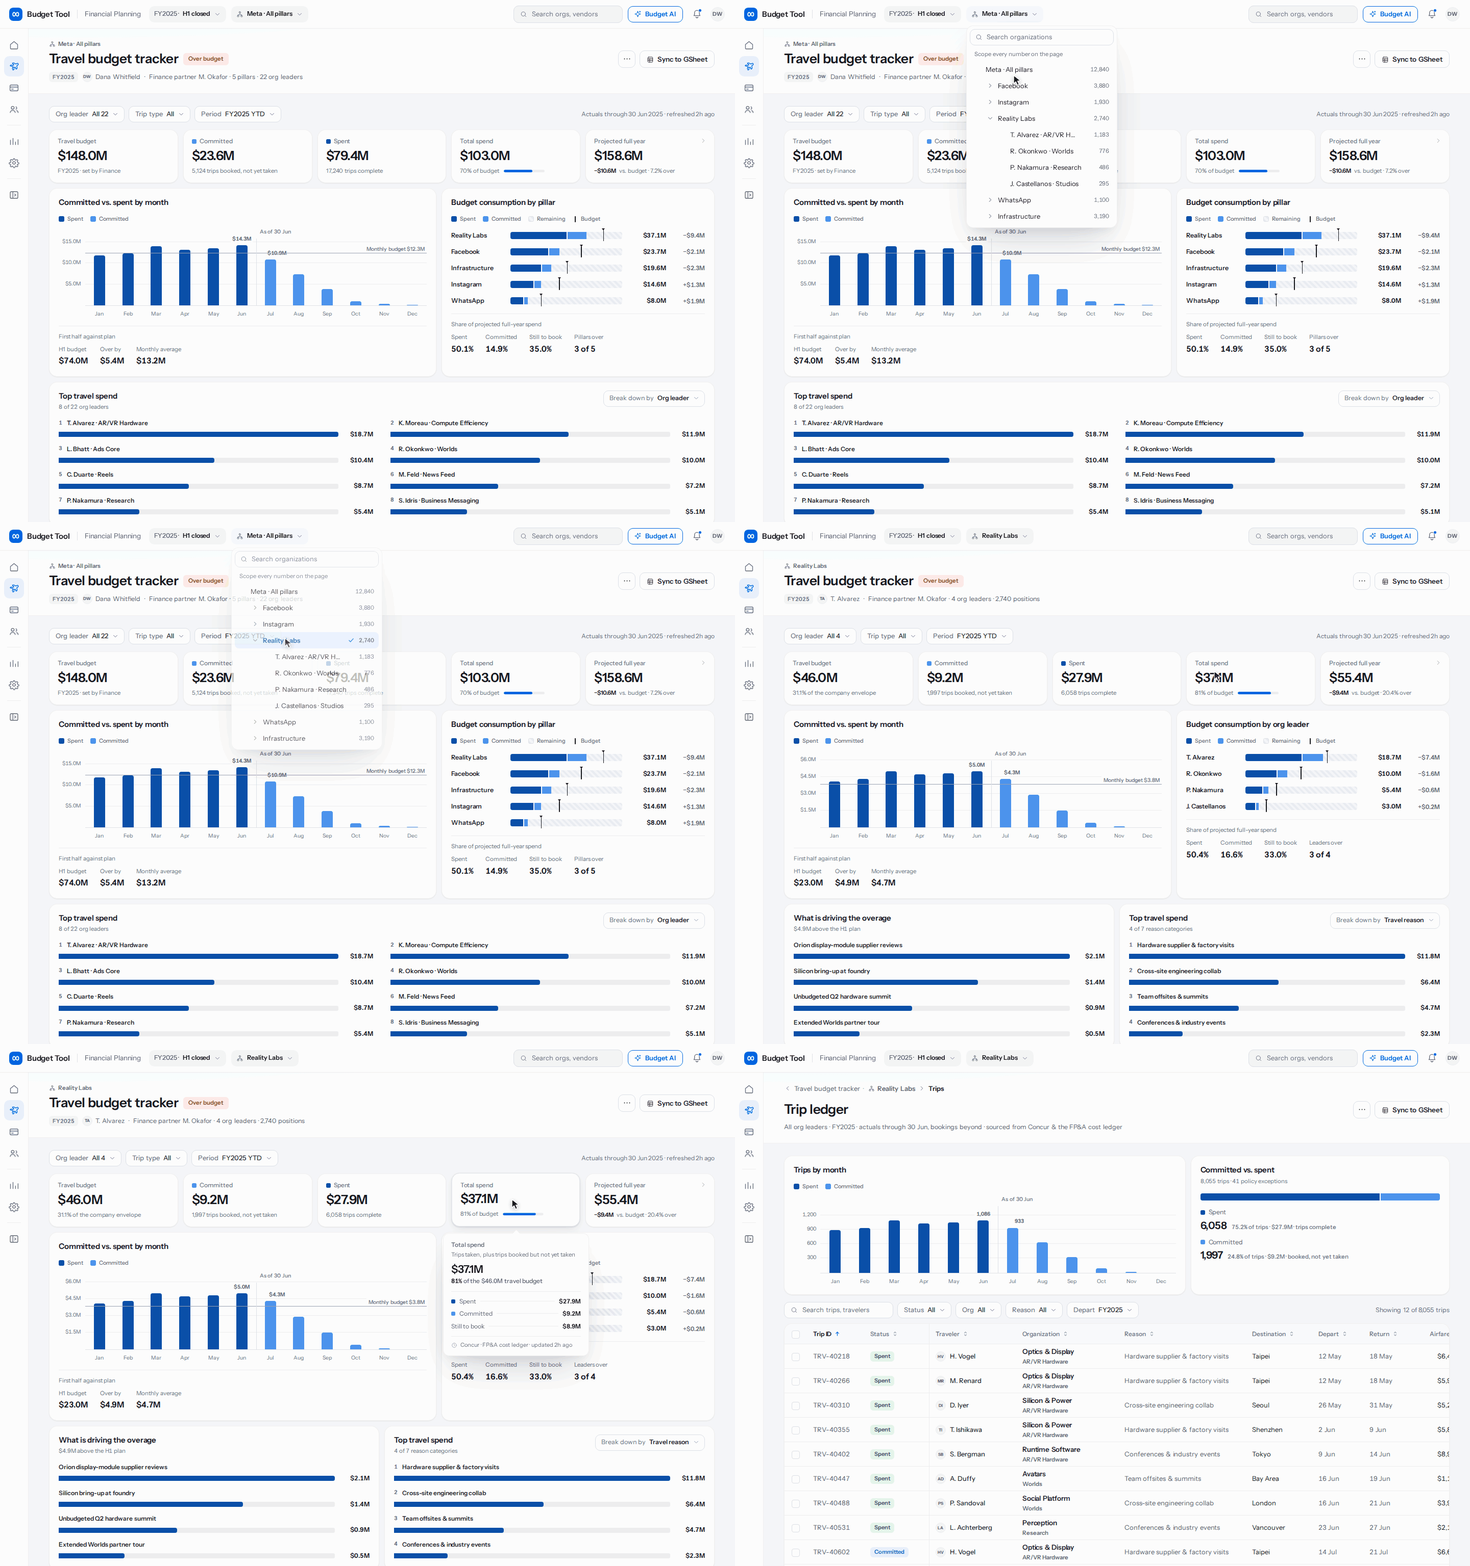
Travel and Headcount had a Phase 1 before I took them on. It proved the demand and exposed four problems, and each one set the direction for what I built next.
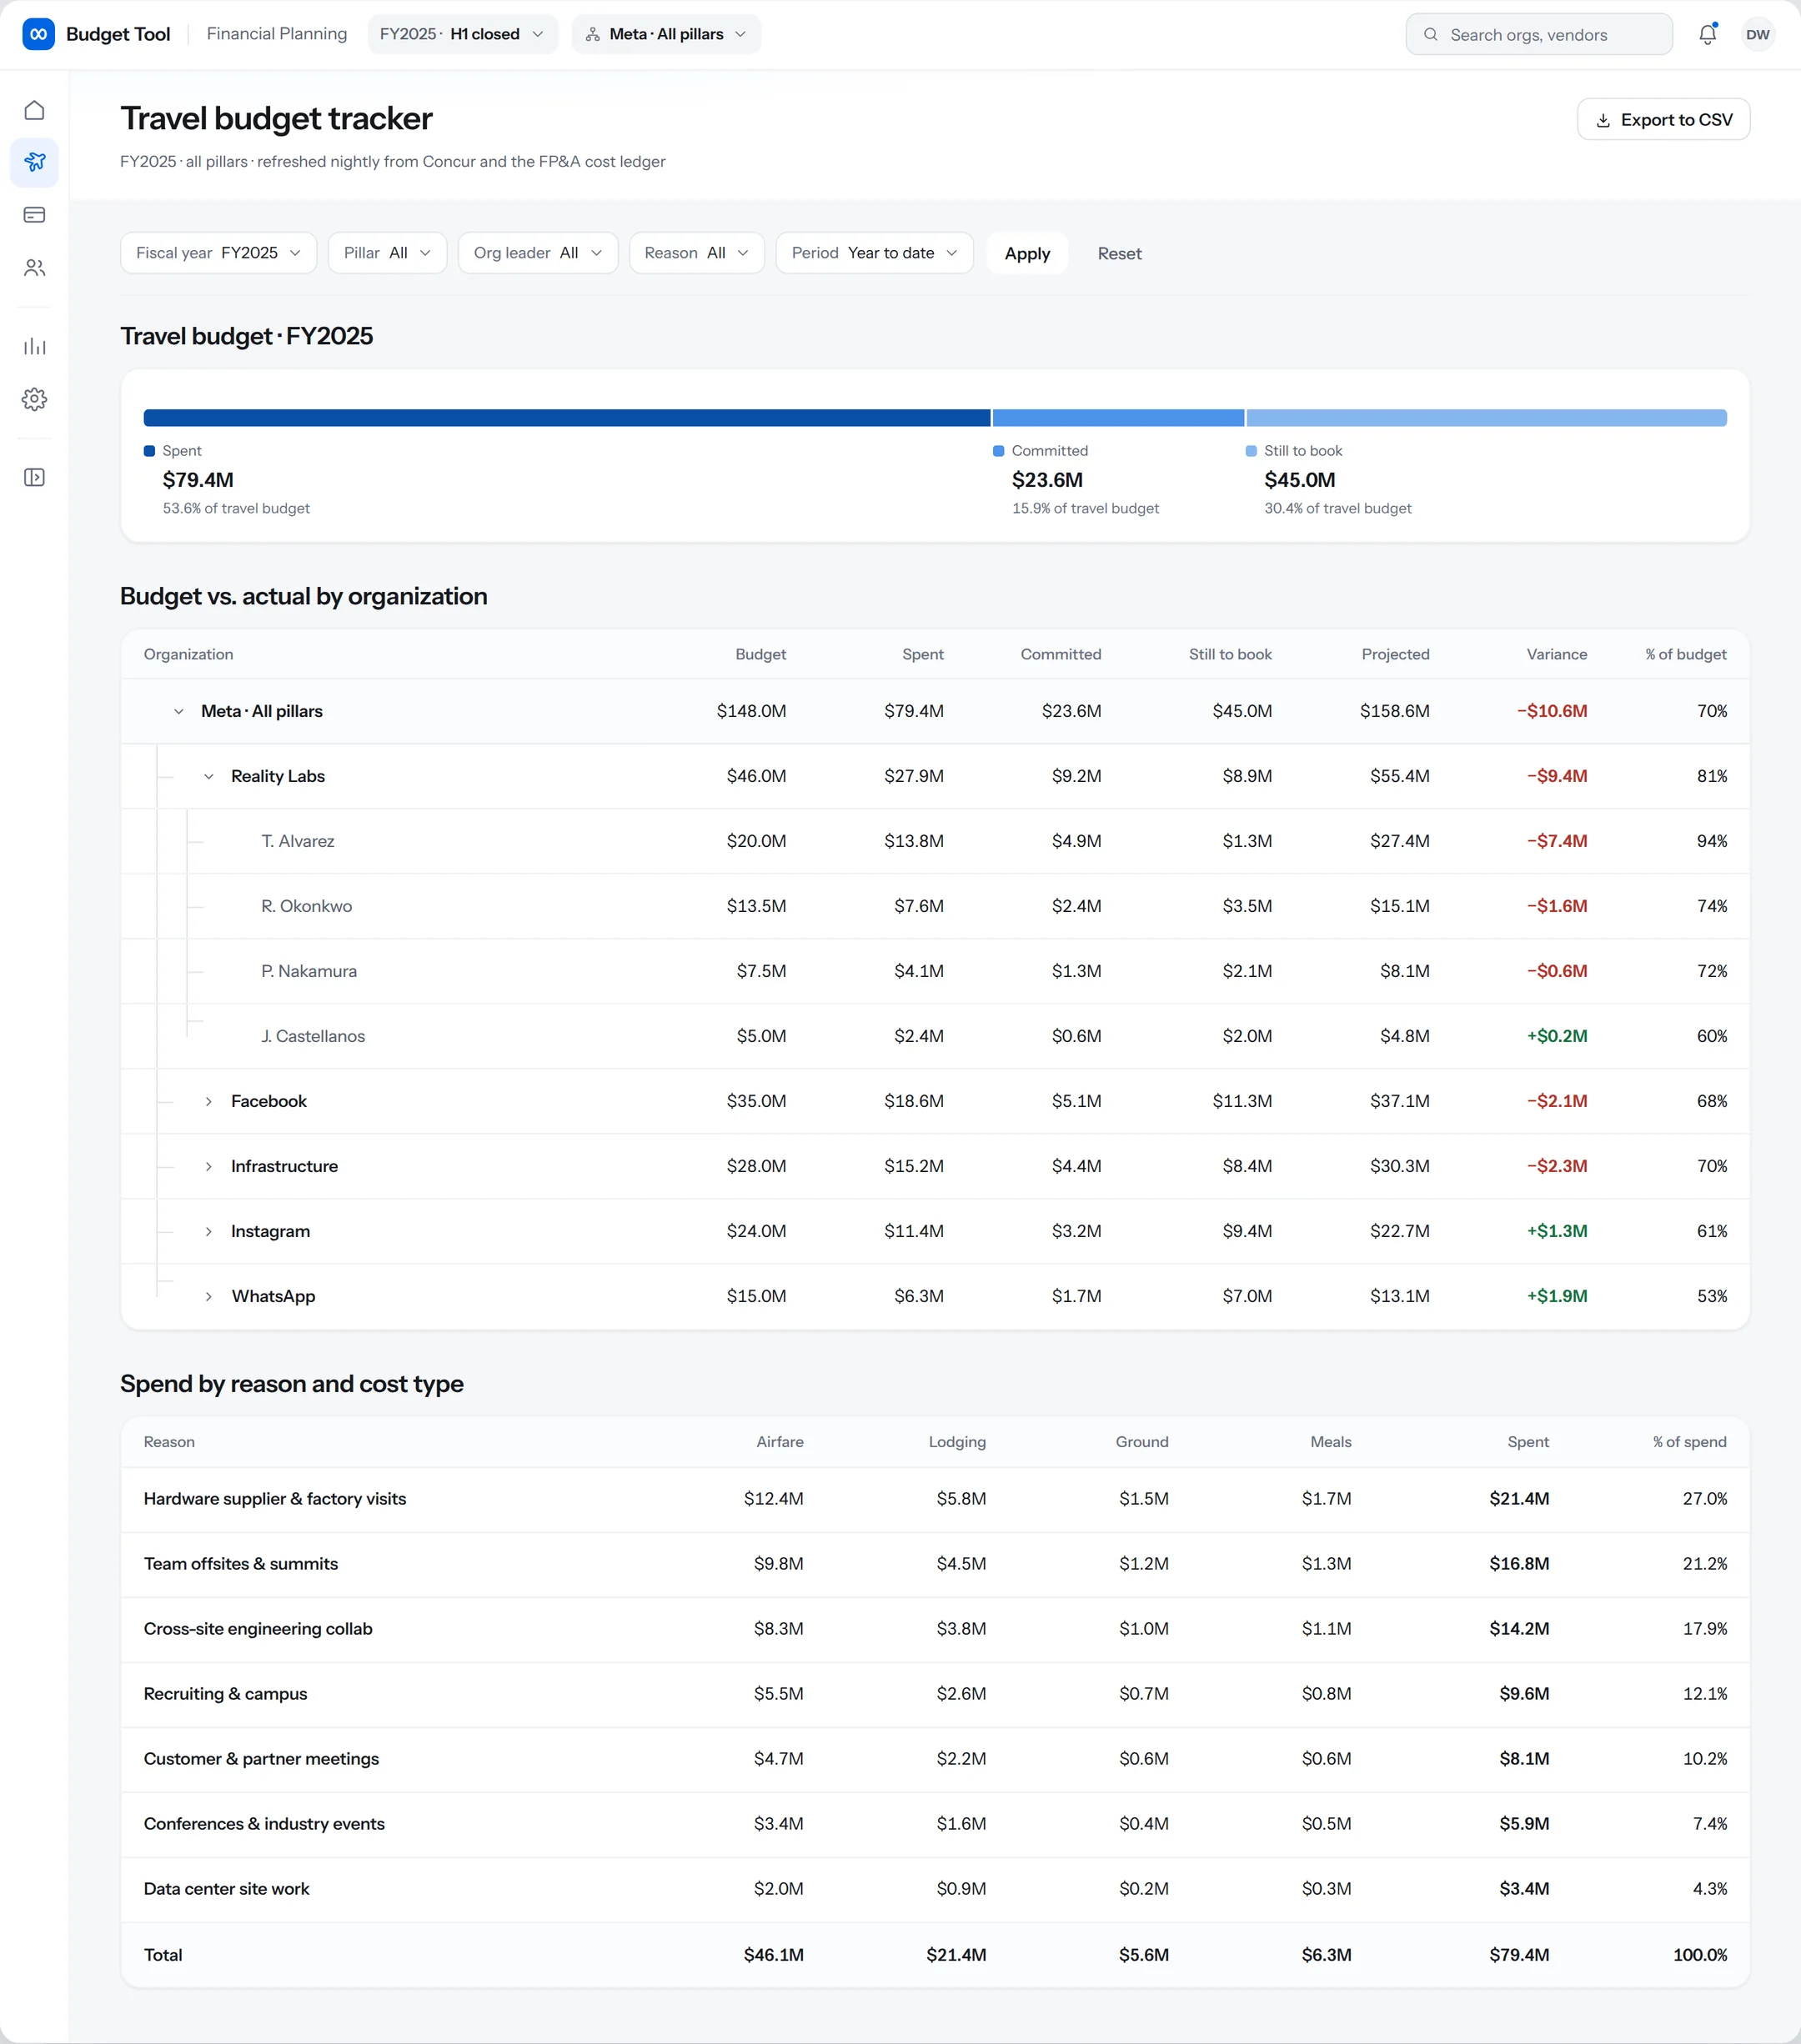
Dense tables left executives questioning accuracy, with no story in the data.
Visualizations for leaders who are not finance experts, and tables kept only where the detail was the point.
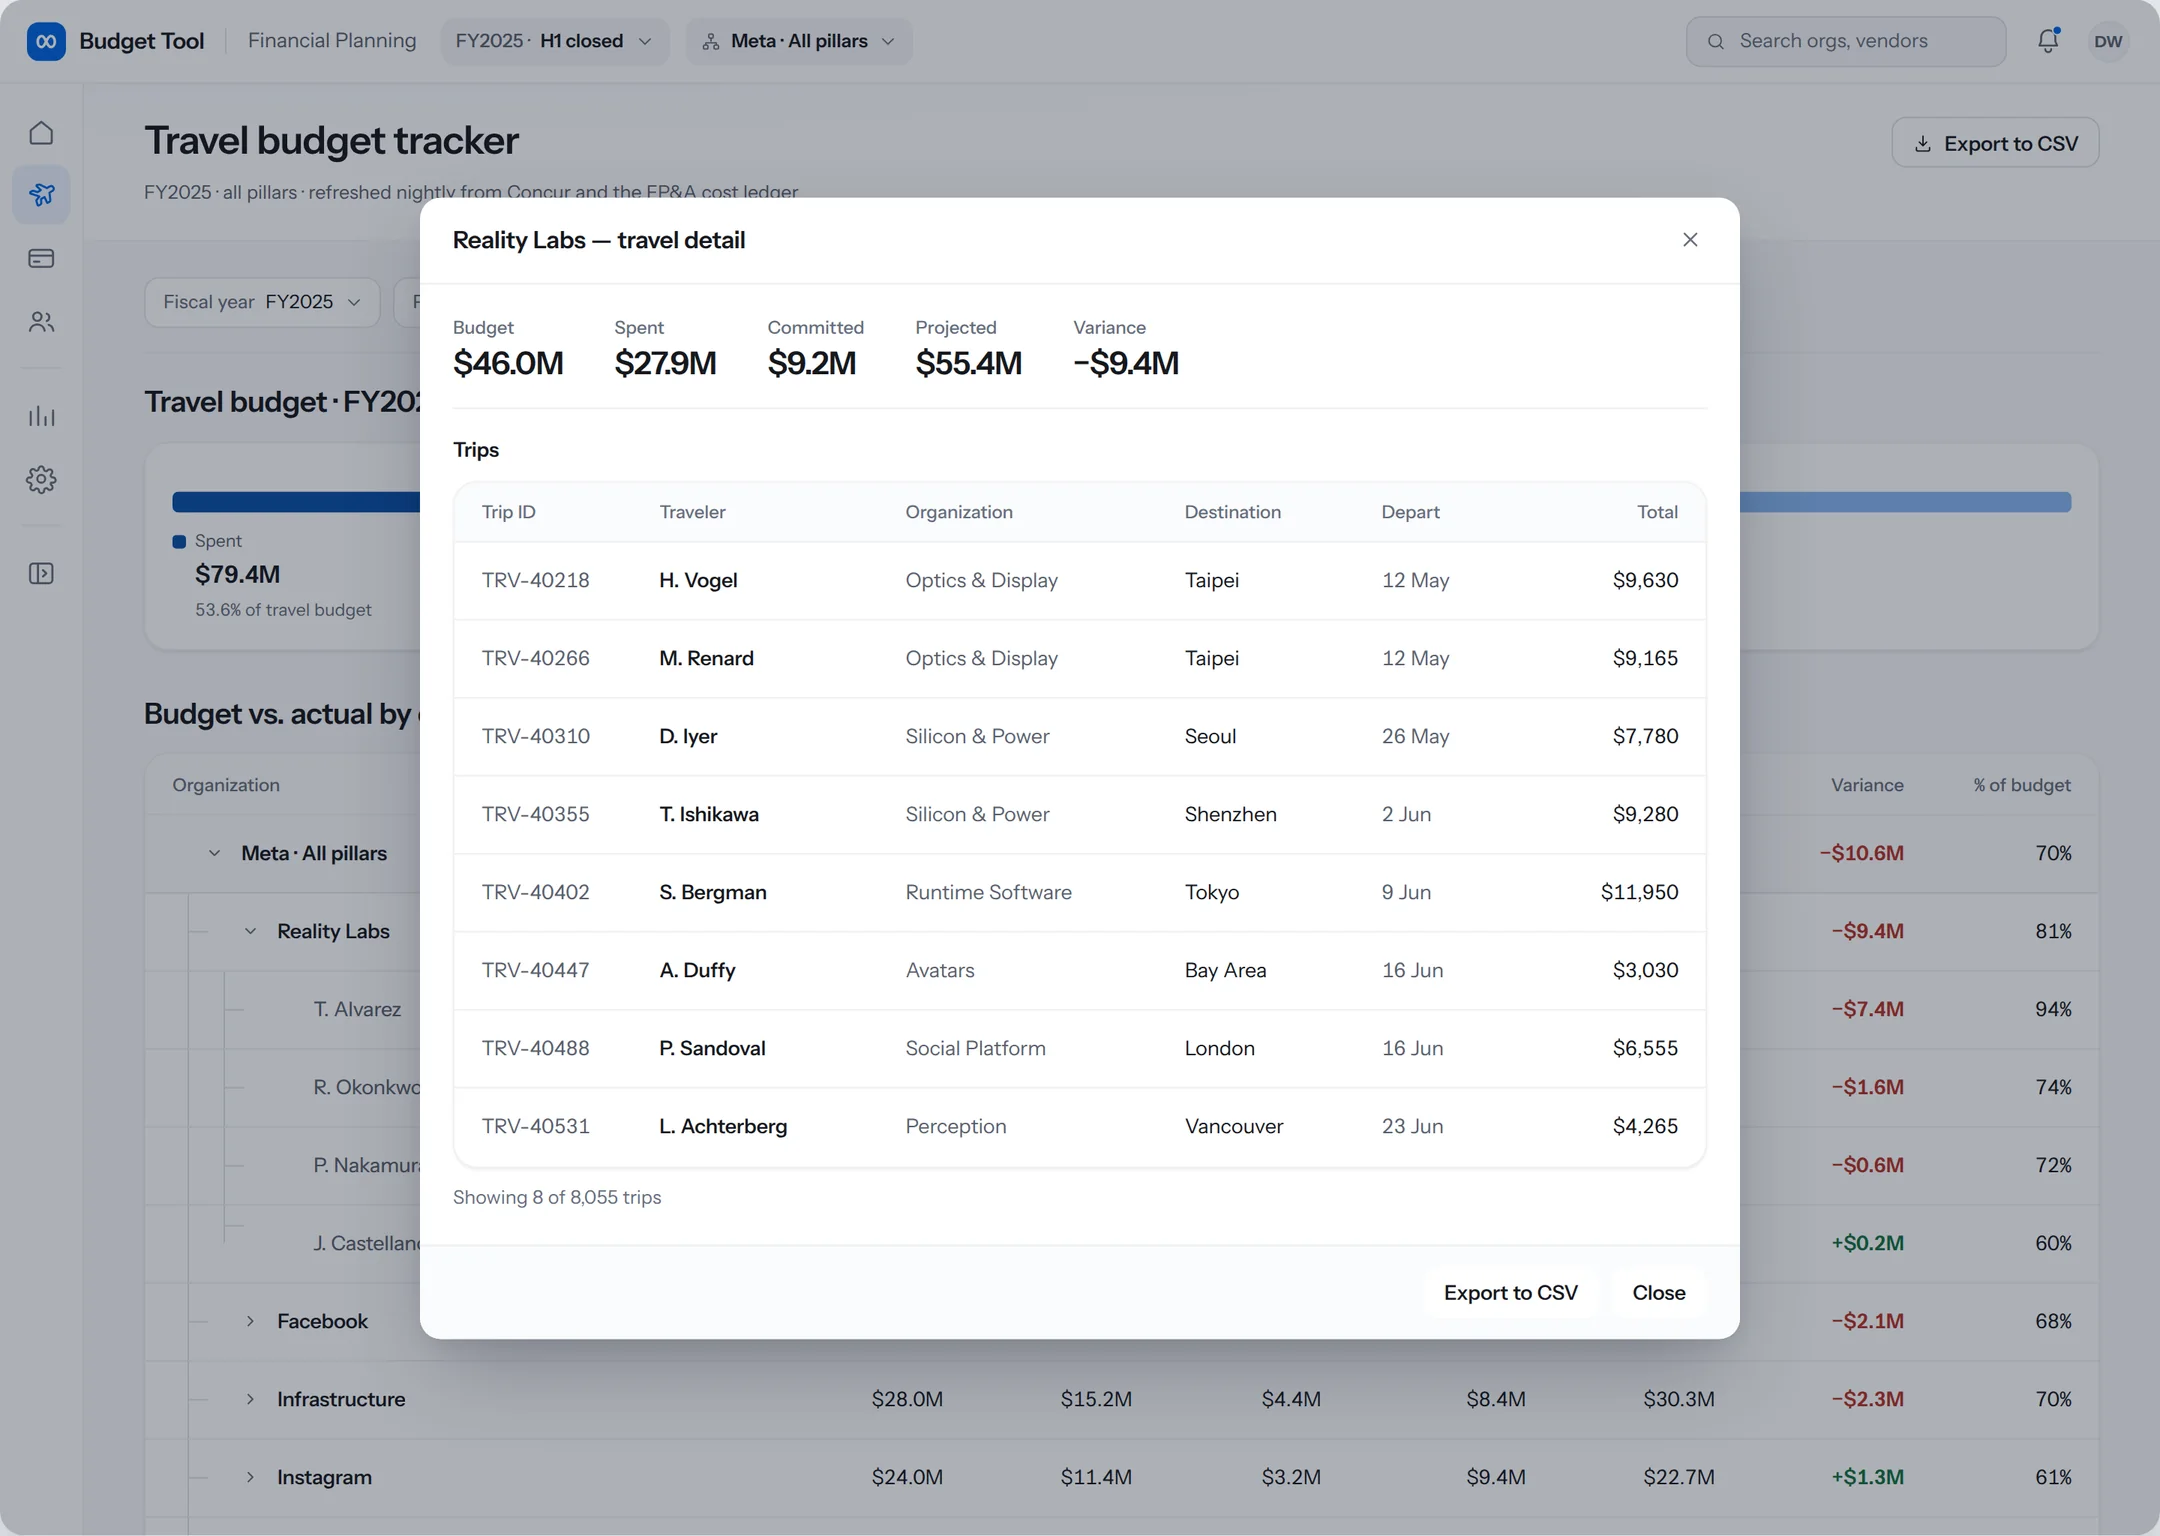
A rushed MVP used modal pop-ups, so there was no real detail behind any number.
Real pages with consistent drill-down, so any figure traces back to its source.
One-off patterns meant every new spend category would need its own mental model.
Every data visual standardized, from variance framing through drill-down.
Finding a specific number meant hunting through tables and filters.
An assistant scoped to on-screen data, with every answer verifiable against the table beside it.
 Illustrative data
 Illustrative data
Delivered 8 design enhancements and 11 new capabilities focused on data visualization and resolving reporting discrepancies.
"This is looking really good... you guys should package it up and sell it to other companies."
 Illustrative data
 Illustrative data
Led the 0 to 1 design of a comprehensive budget owner dashboard, streamlining planning and increasing expense visibility by roughly 22 percent.
 Illustrative data
 Illustrative data
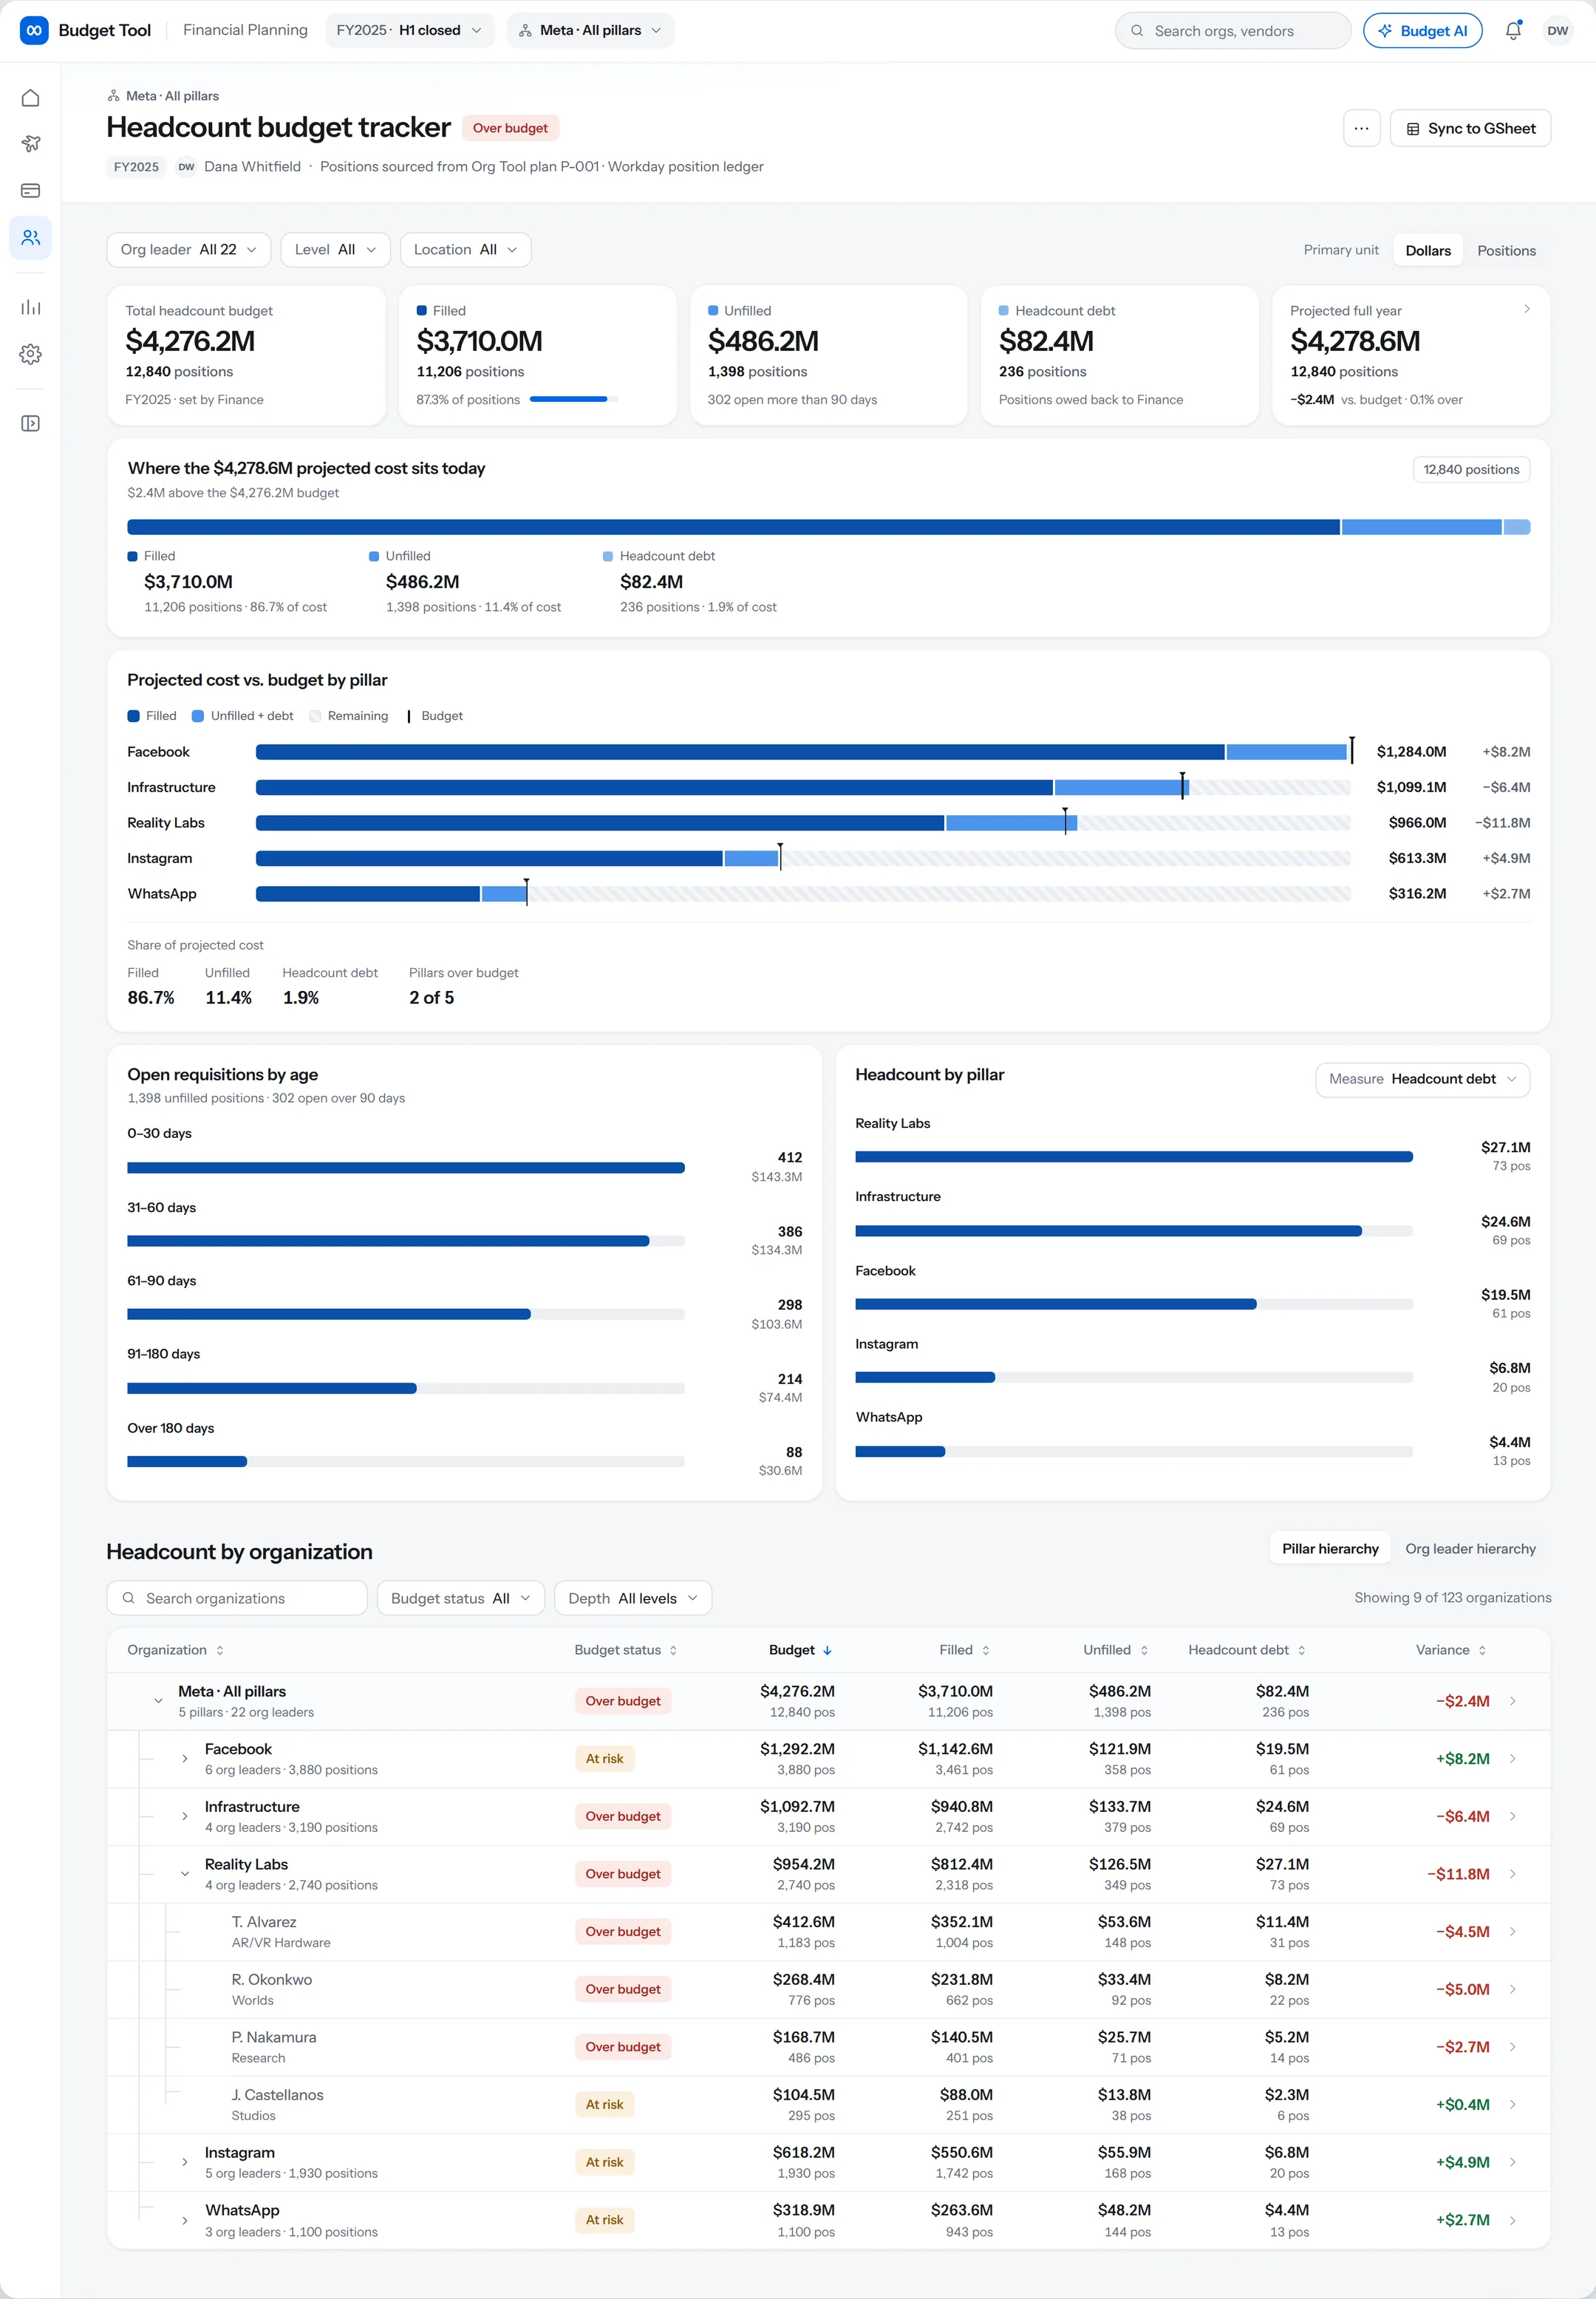
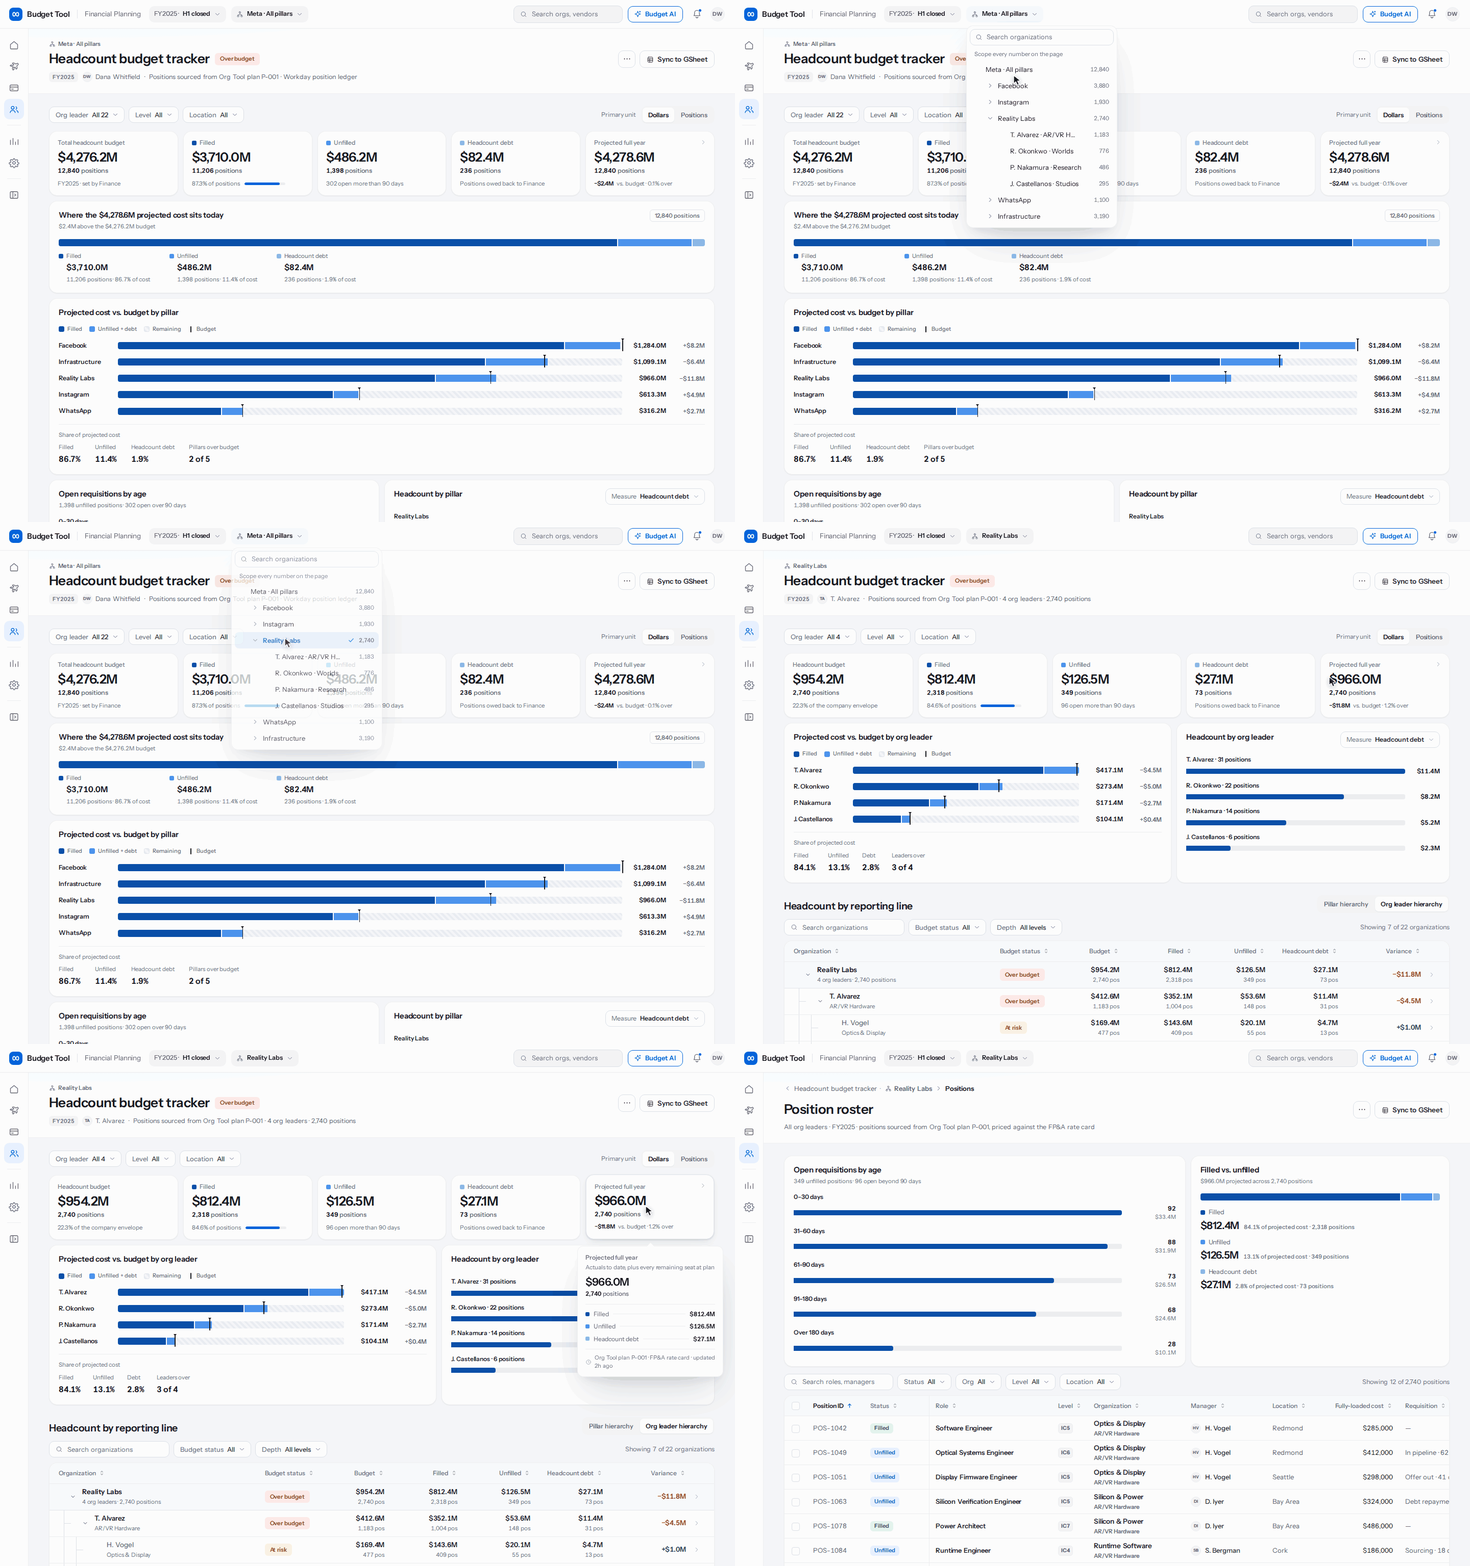
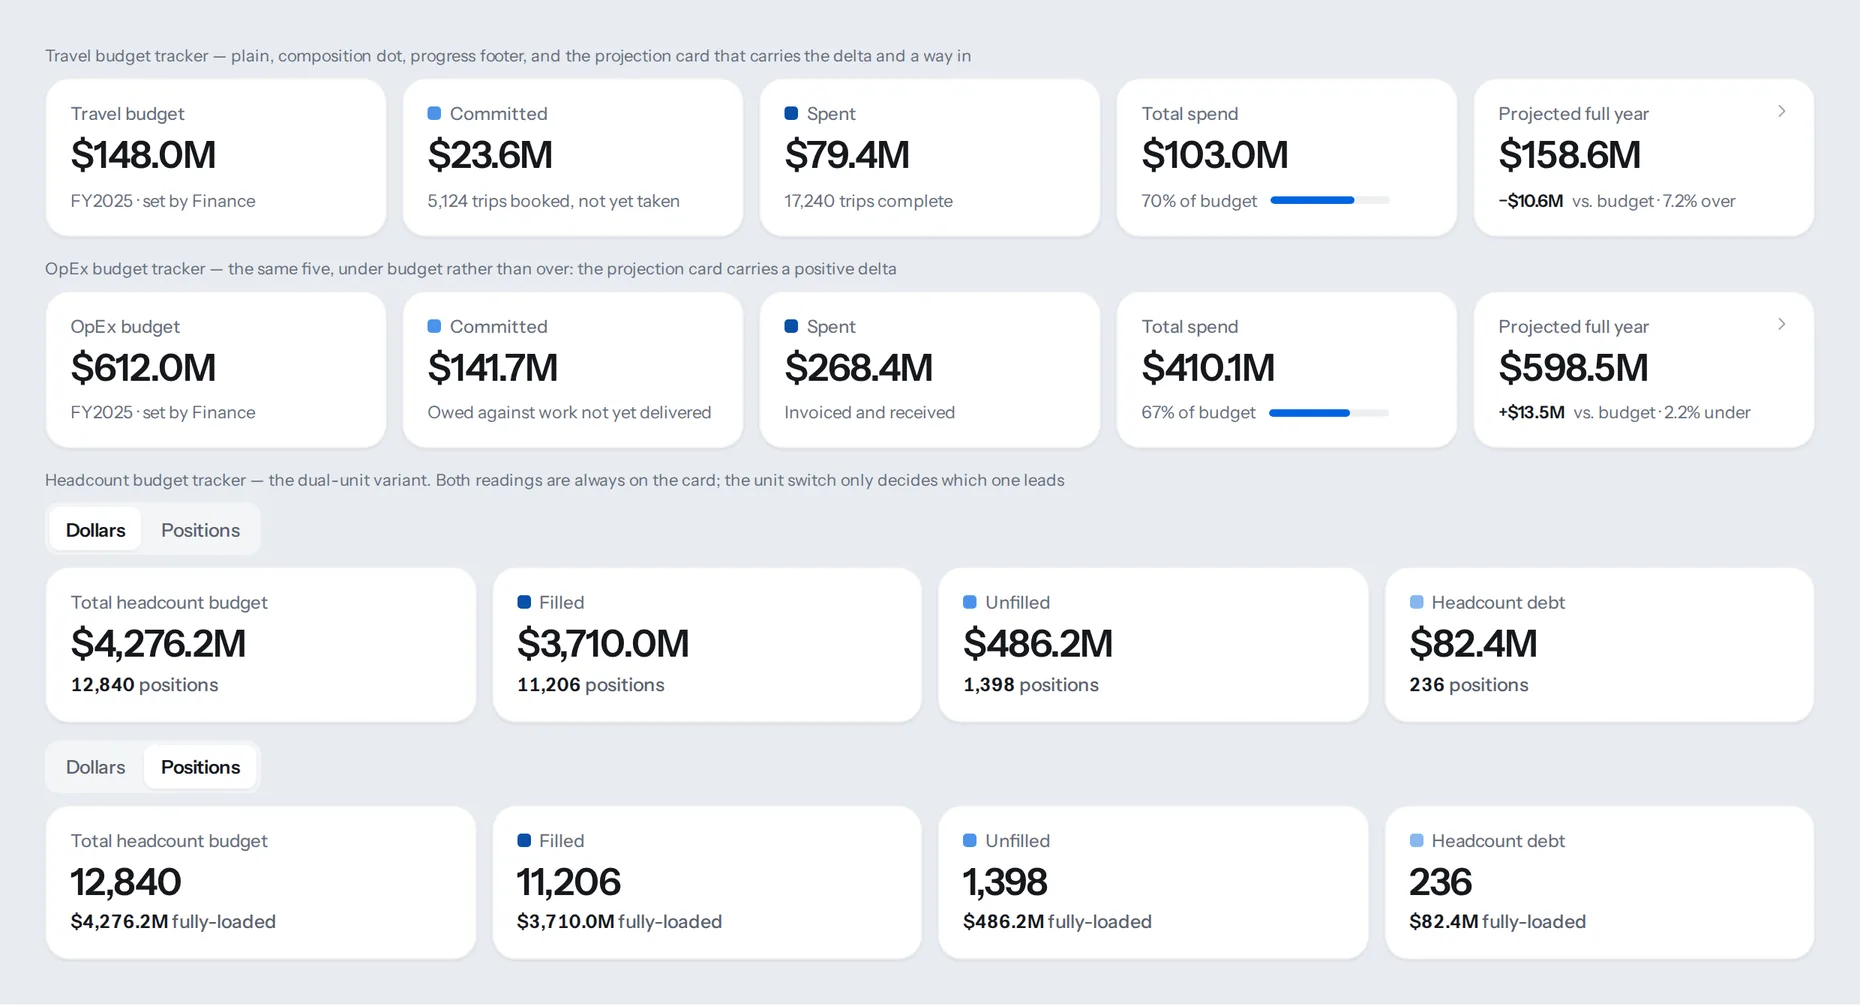
Delivered Phase 2 enhancements covering approximately 40.4 percent of Meta's budget. To close a major data gap, I introduced headcount debt, tracking positions still open after a plan committed to closing them as a first-class metric alongside Filled and Unfilled roles.
 Illustrative data
 Illustrative data
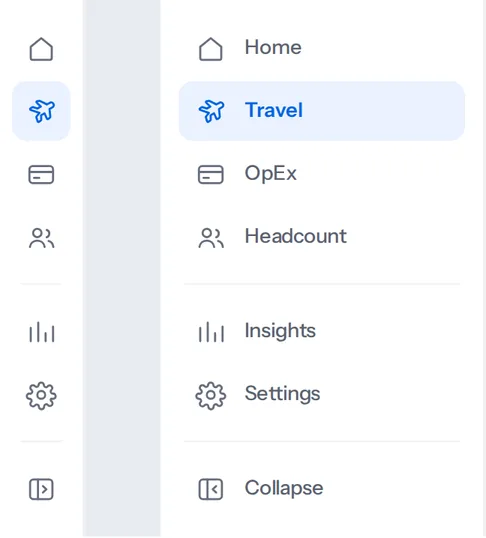
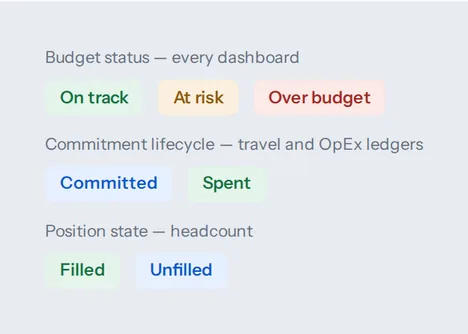
Partnered closely with design and engineering to unify the tool experience across all three surfaces into a single consistent shell and navigation pattern. The same interaction patterns carry across every tracker: one metric card that opens its own composition, one control for re-cutting a card by a different dimension, and one hierarchy that expands from the whole company down to a single manager.
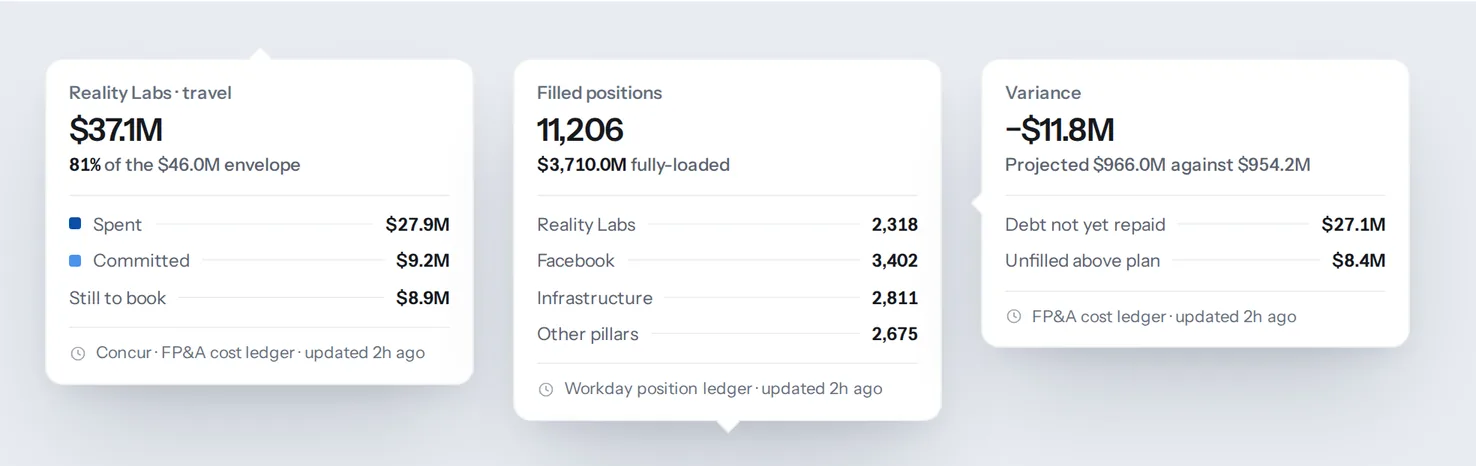 Illustrative data
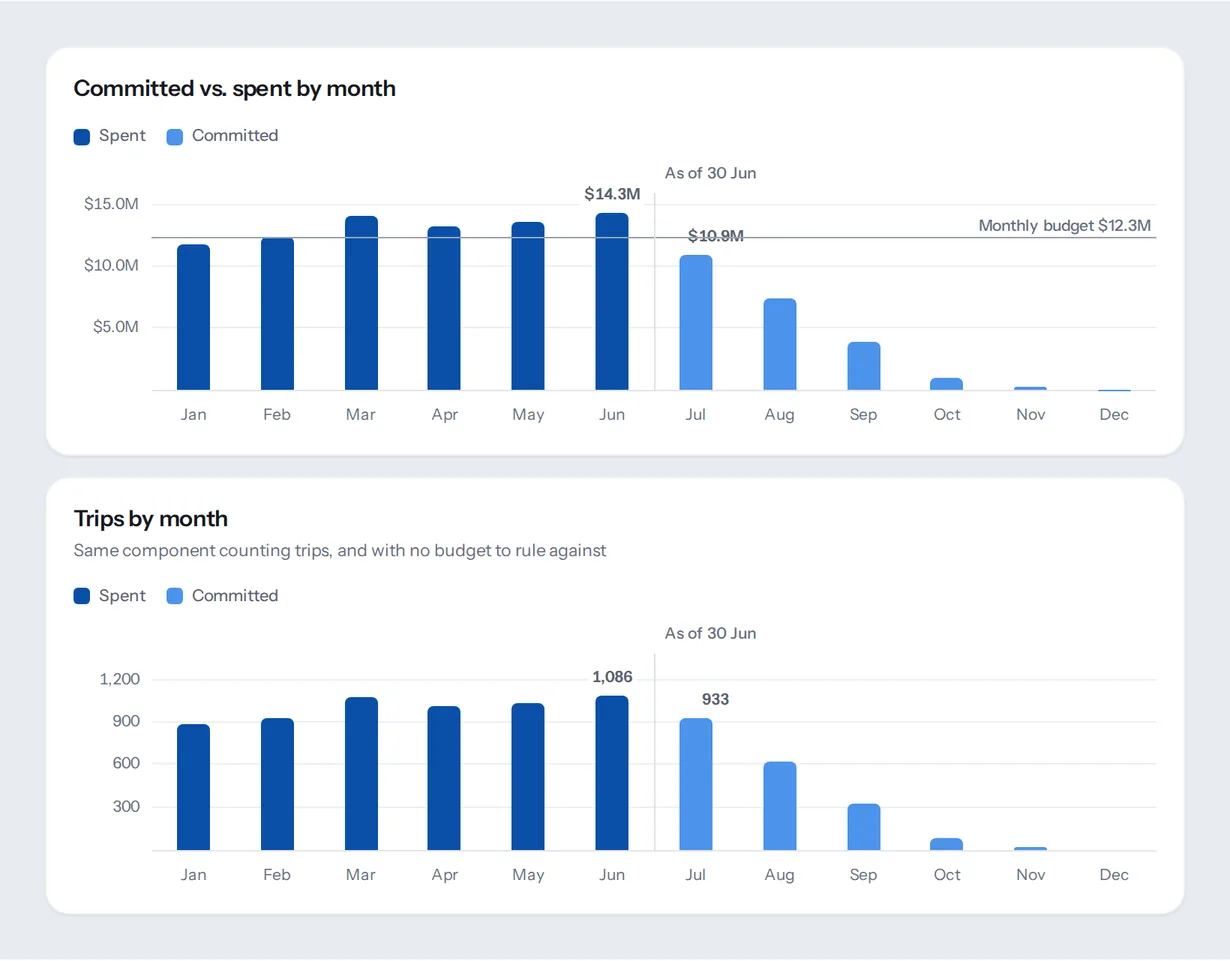
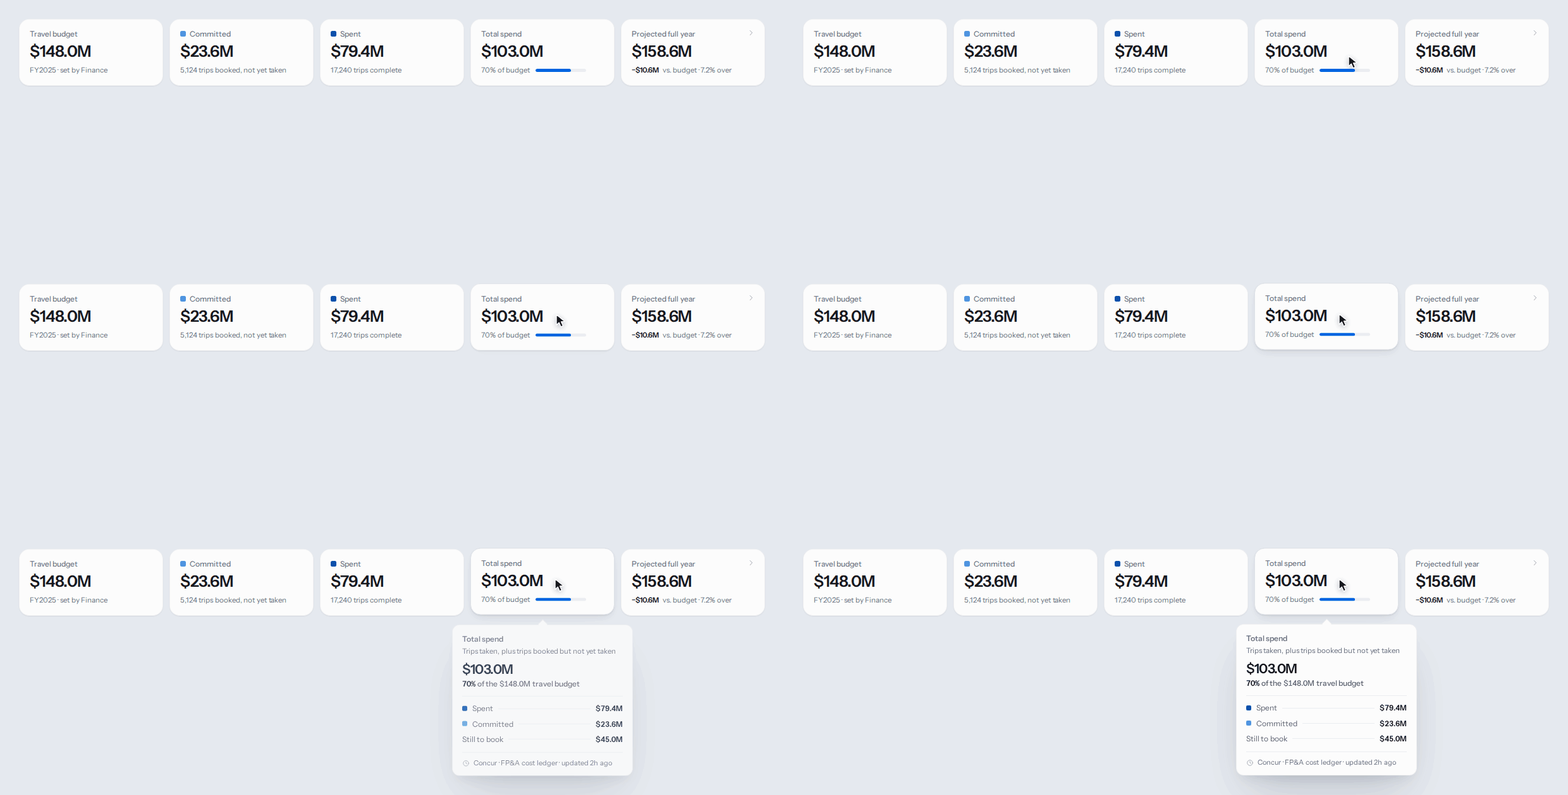
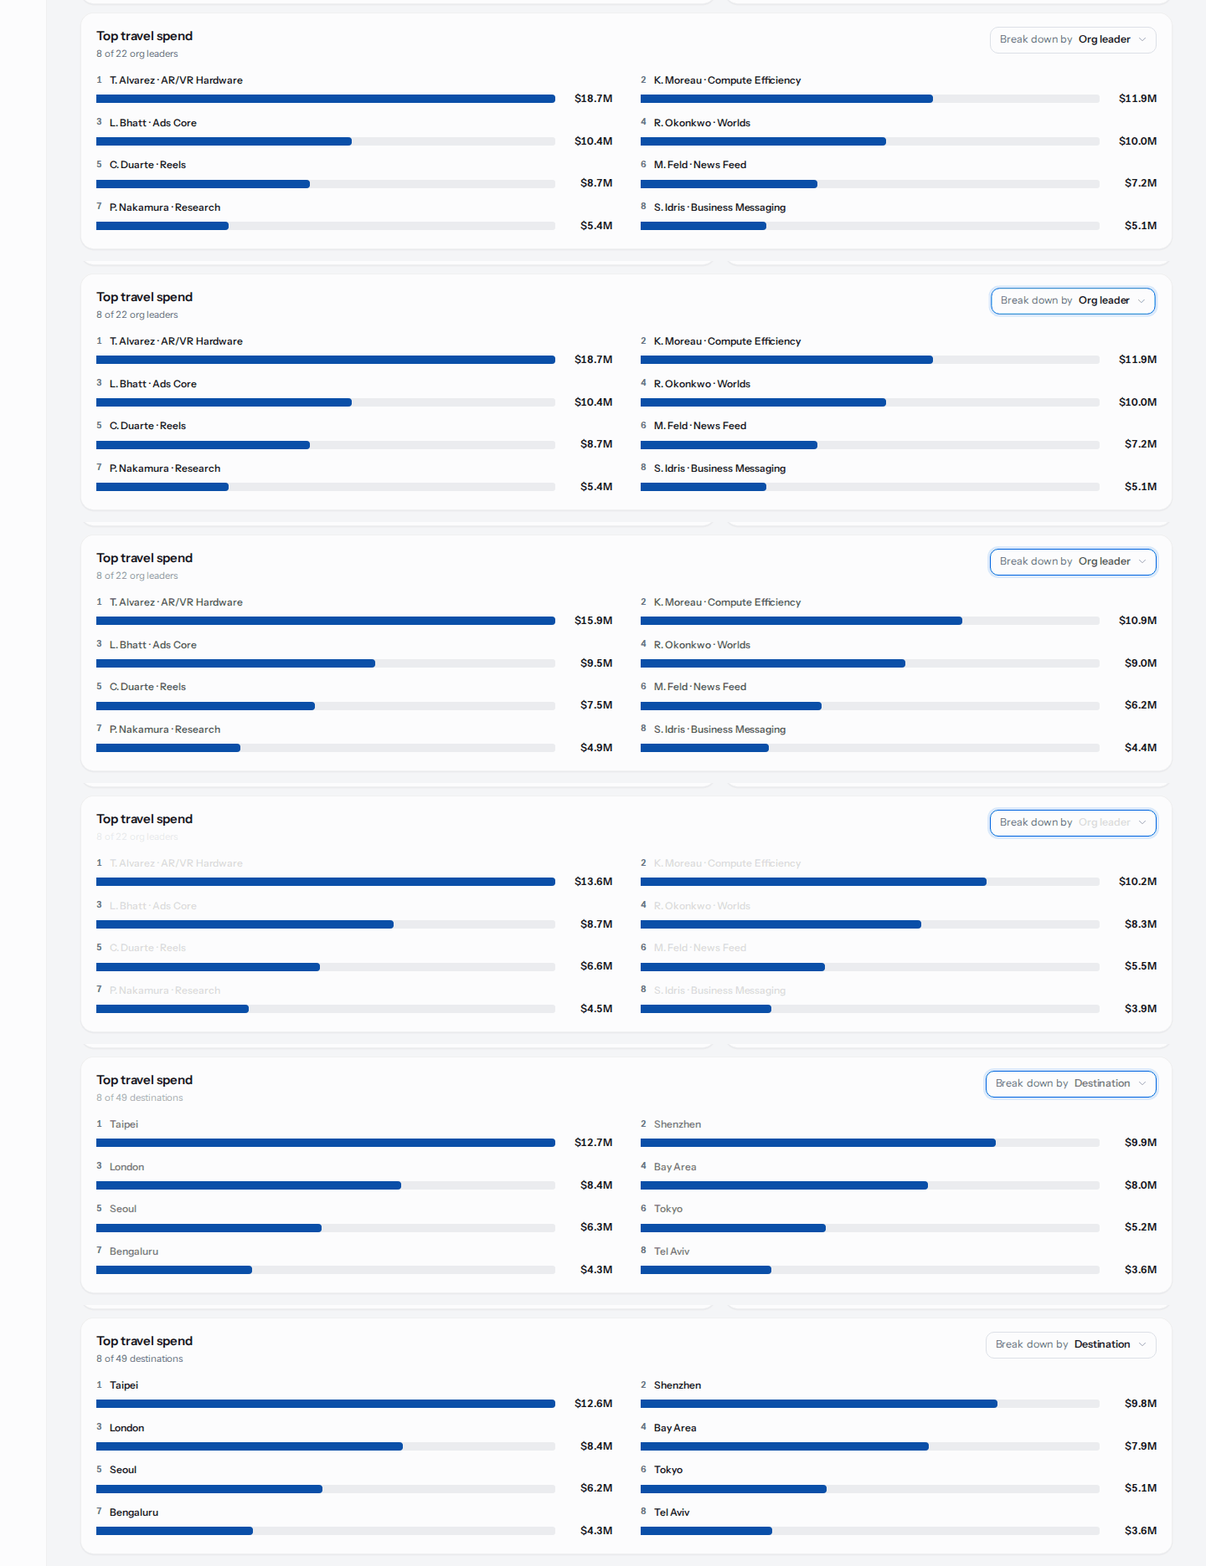 Illustrative data
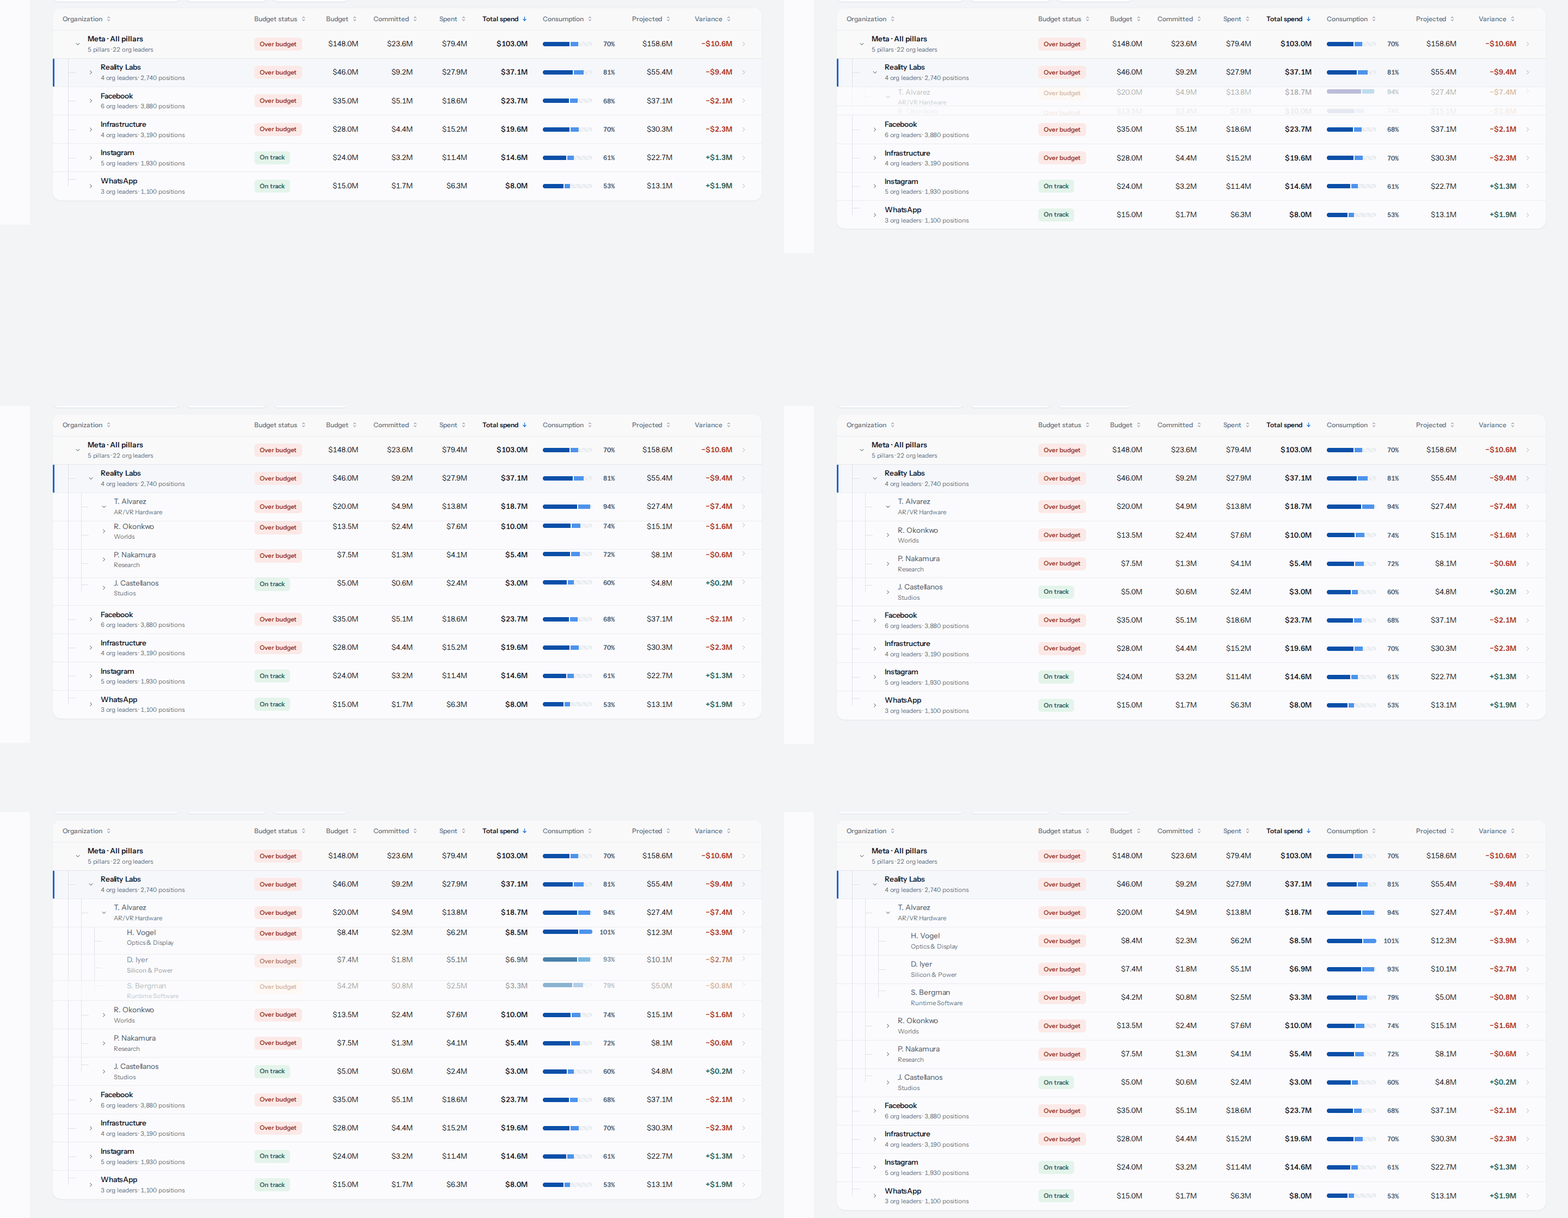 Illustrative data

Co-led strategy and design for an in-workflow AI assistant, which shipped while I was on the team. Because financial decisions carry high consequences, the interaction model prioritized trust and transparency through several principles:
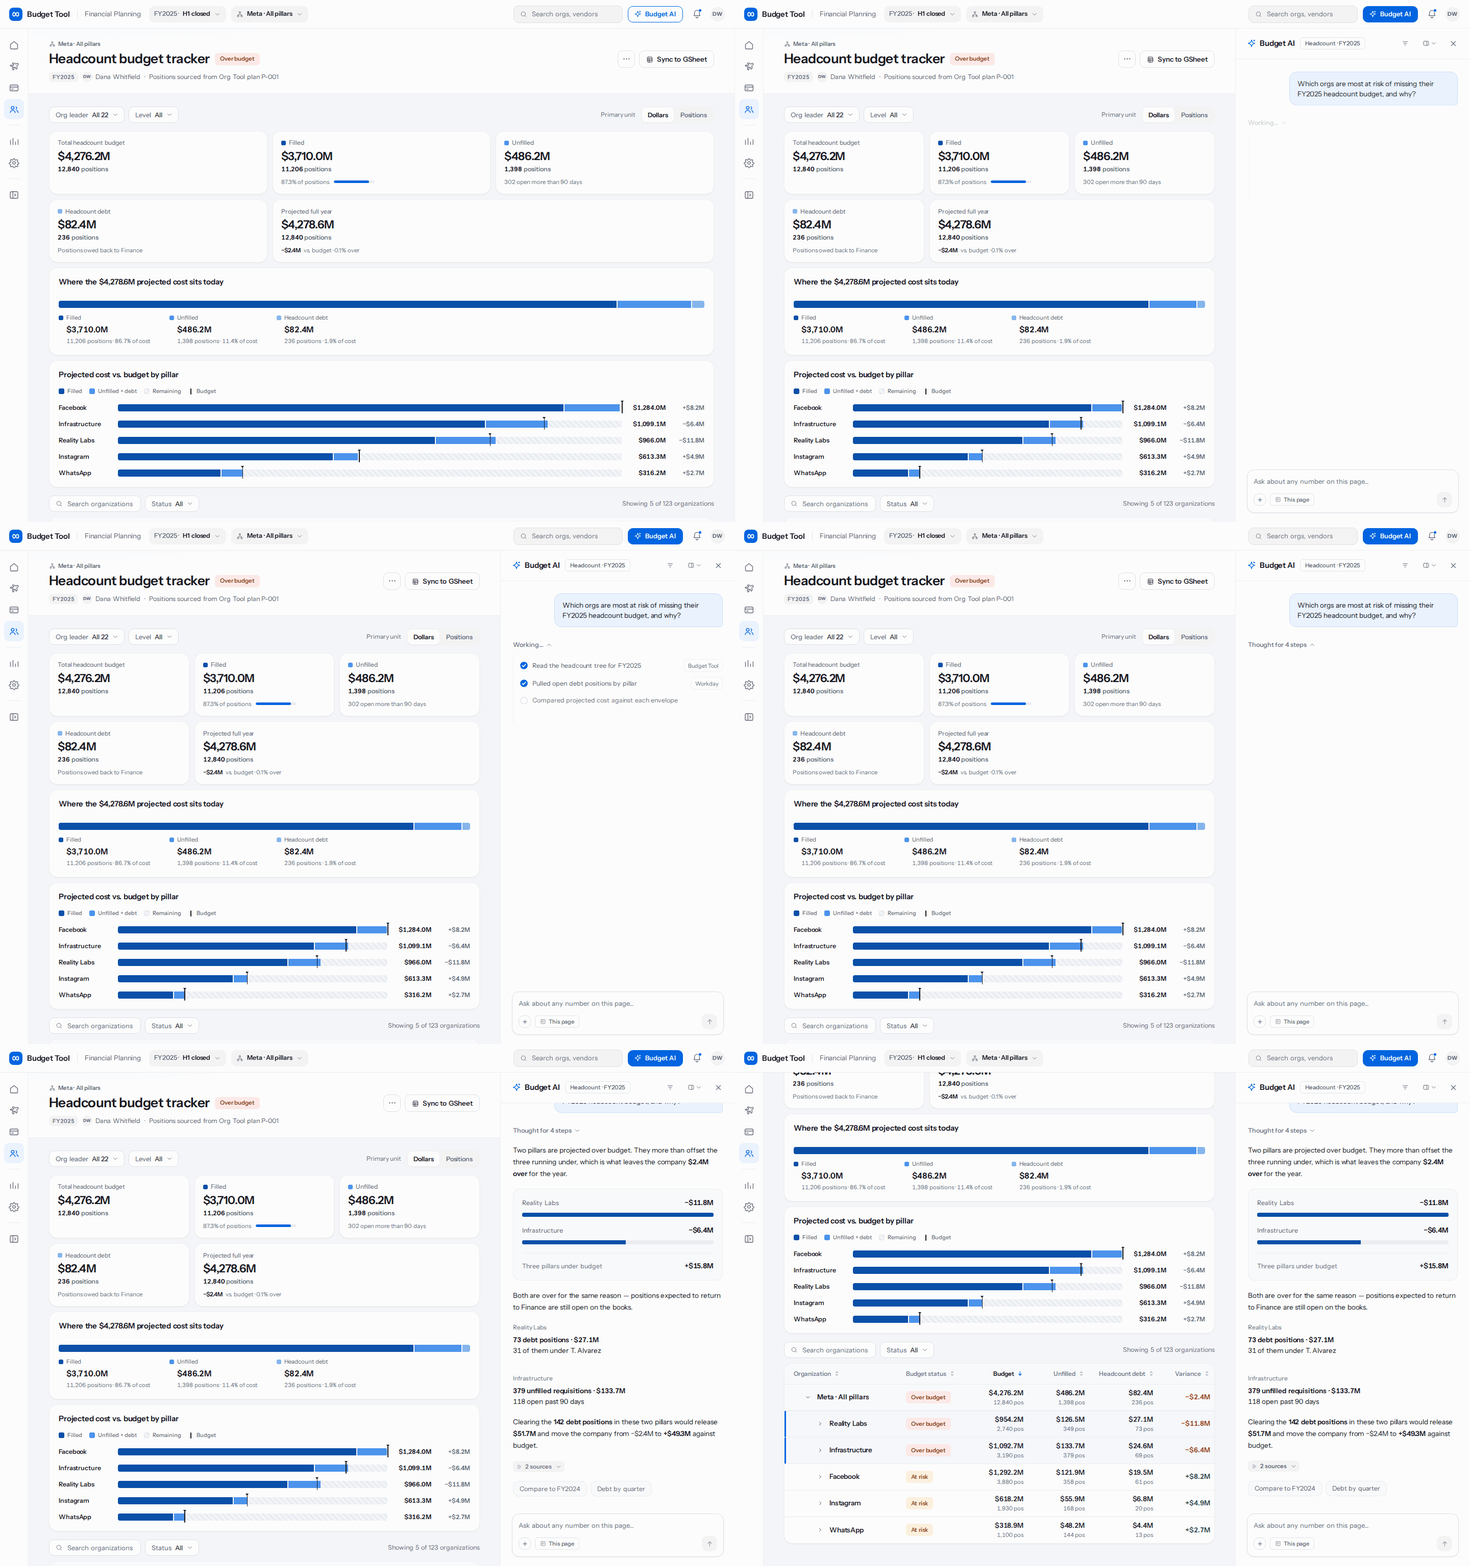 Illustrative data
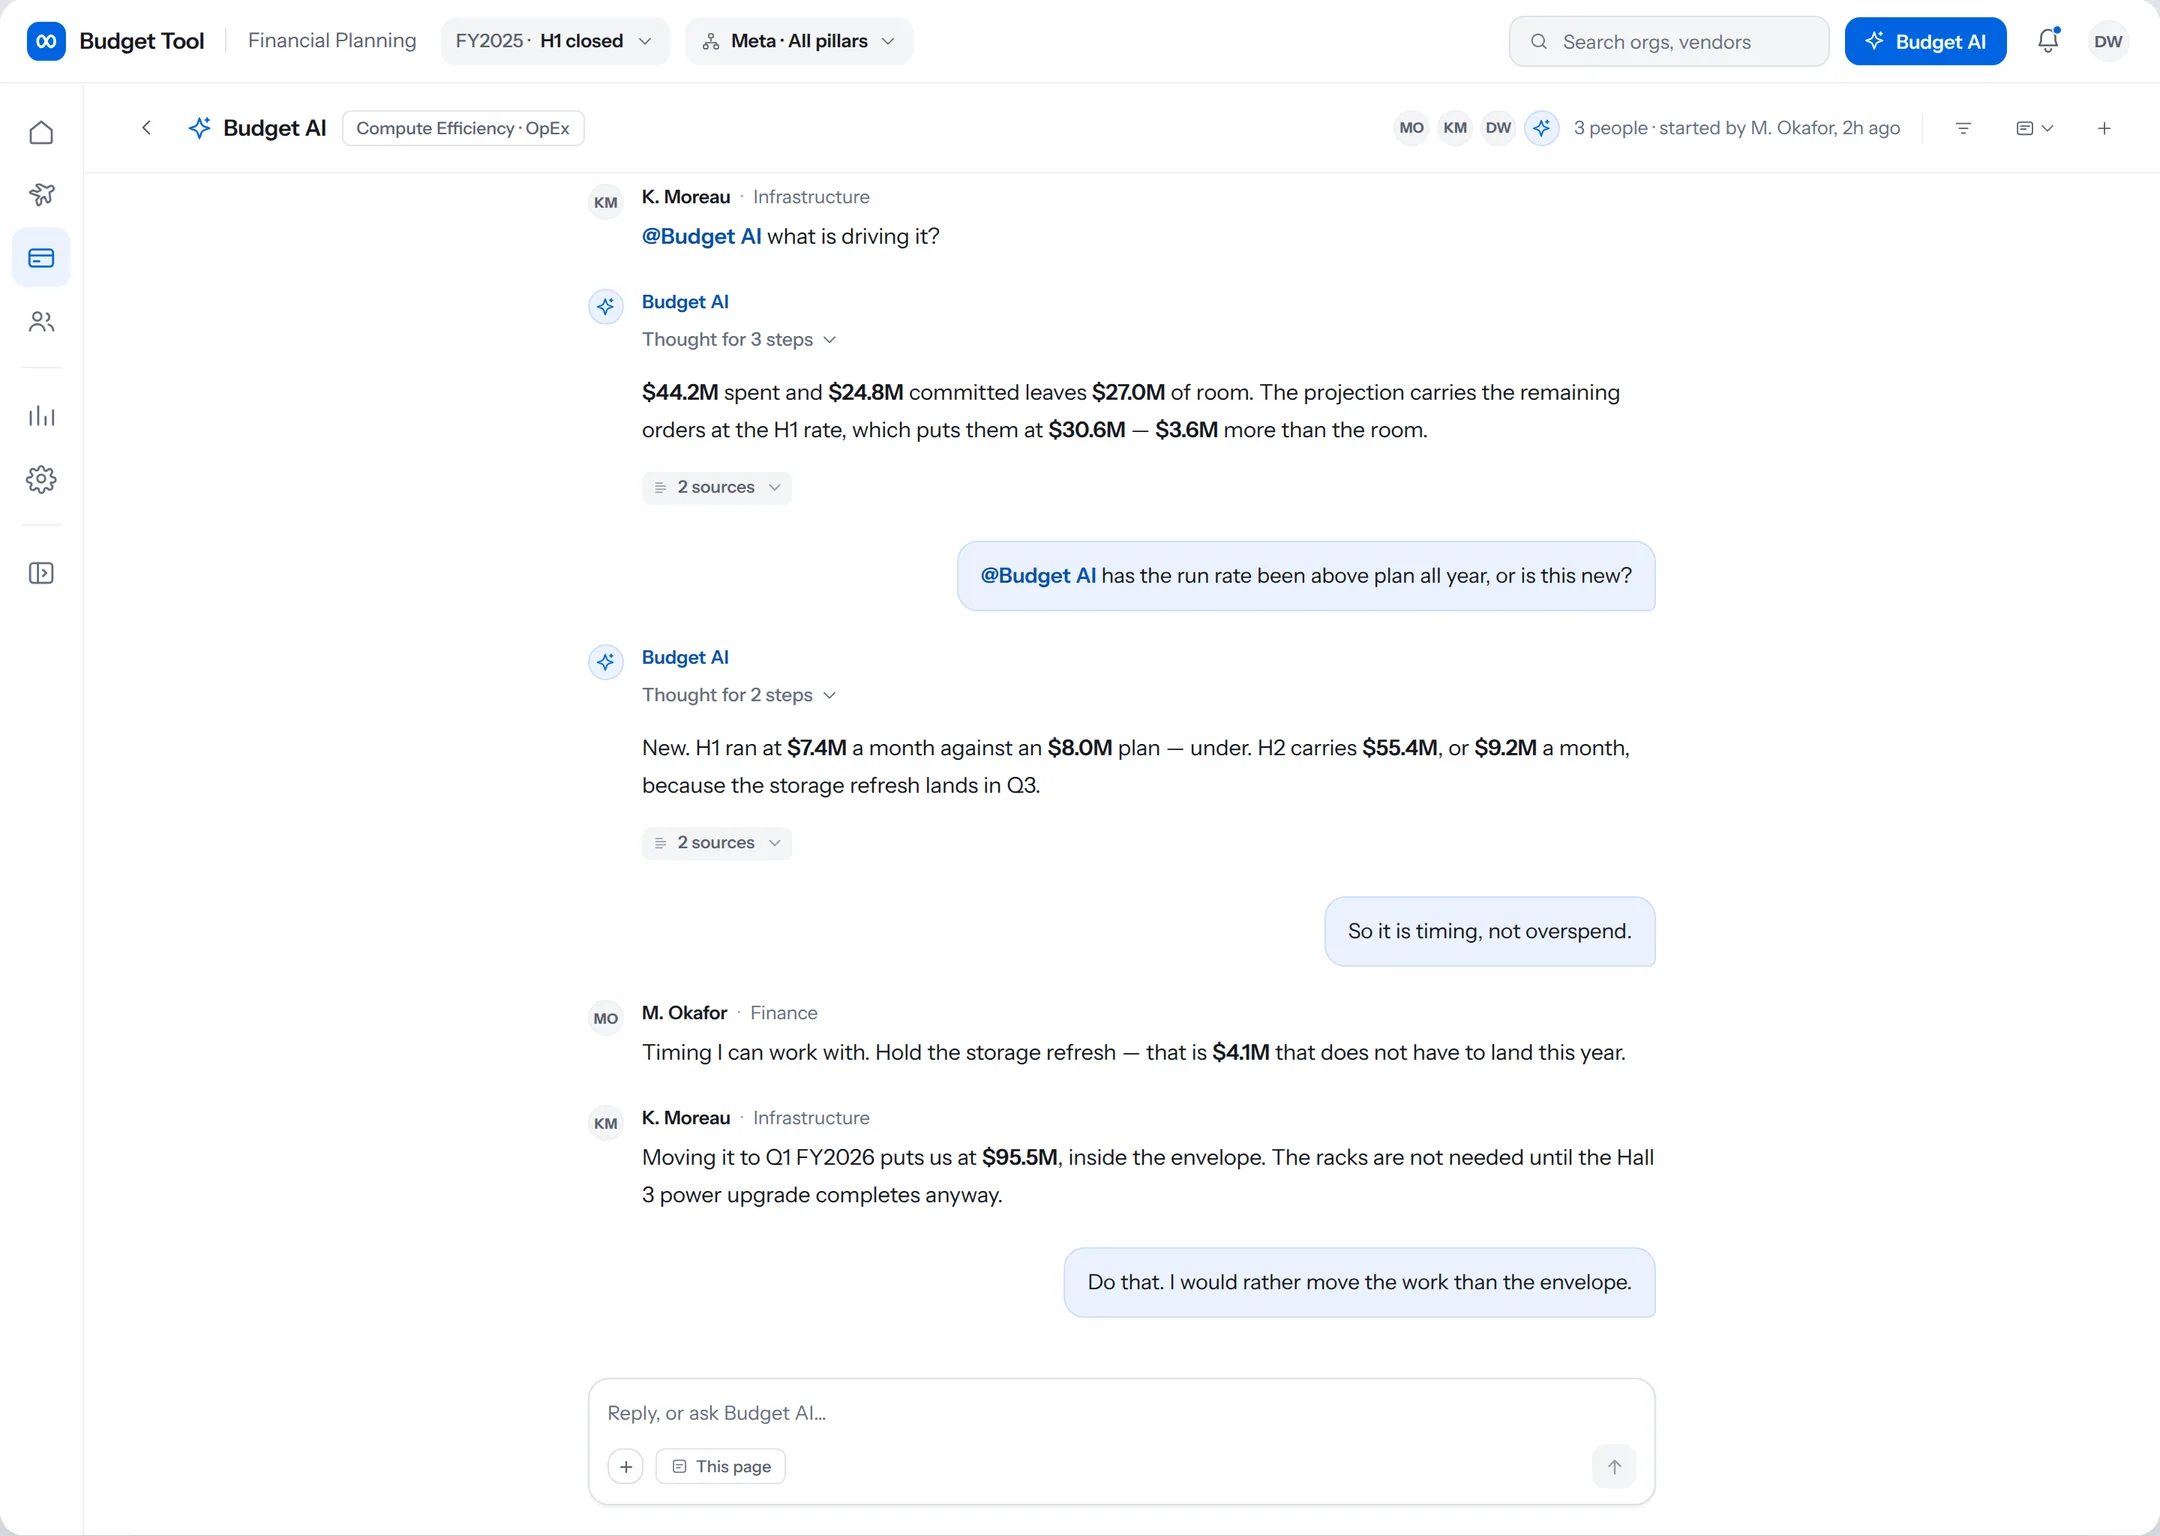 Illustrative data
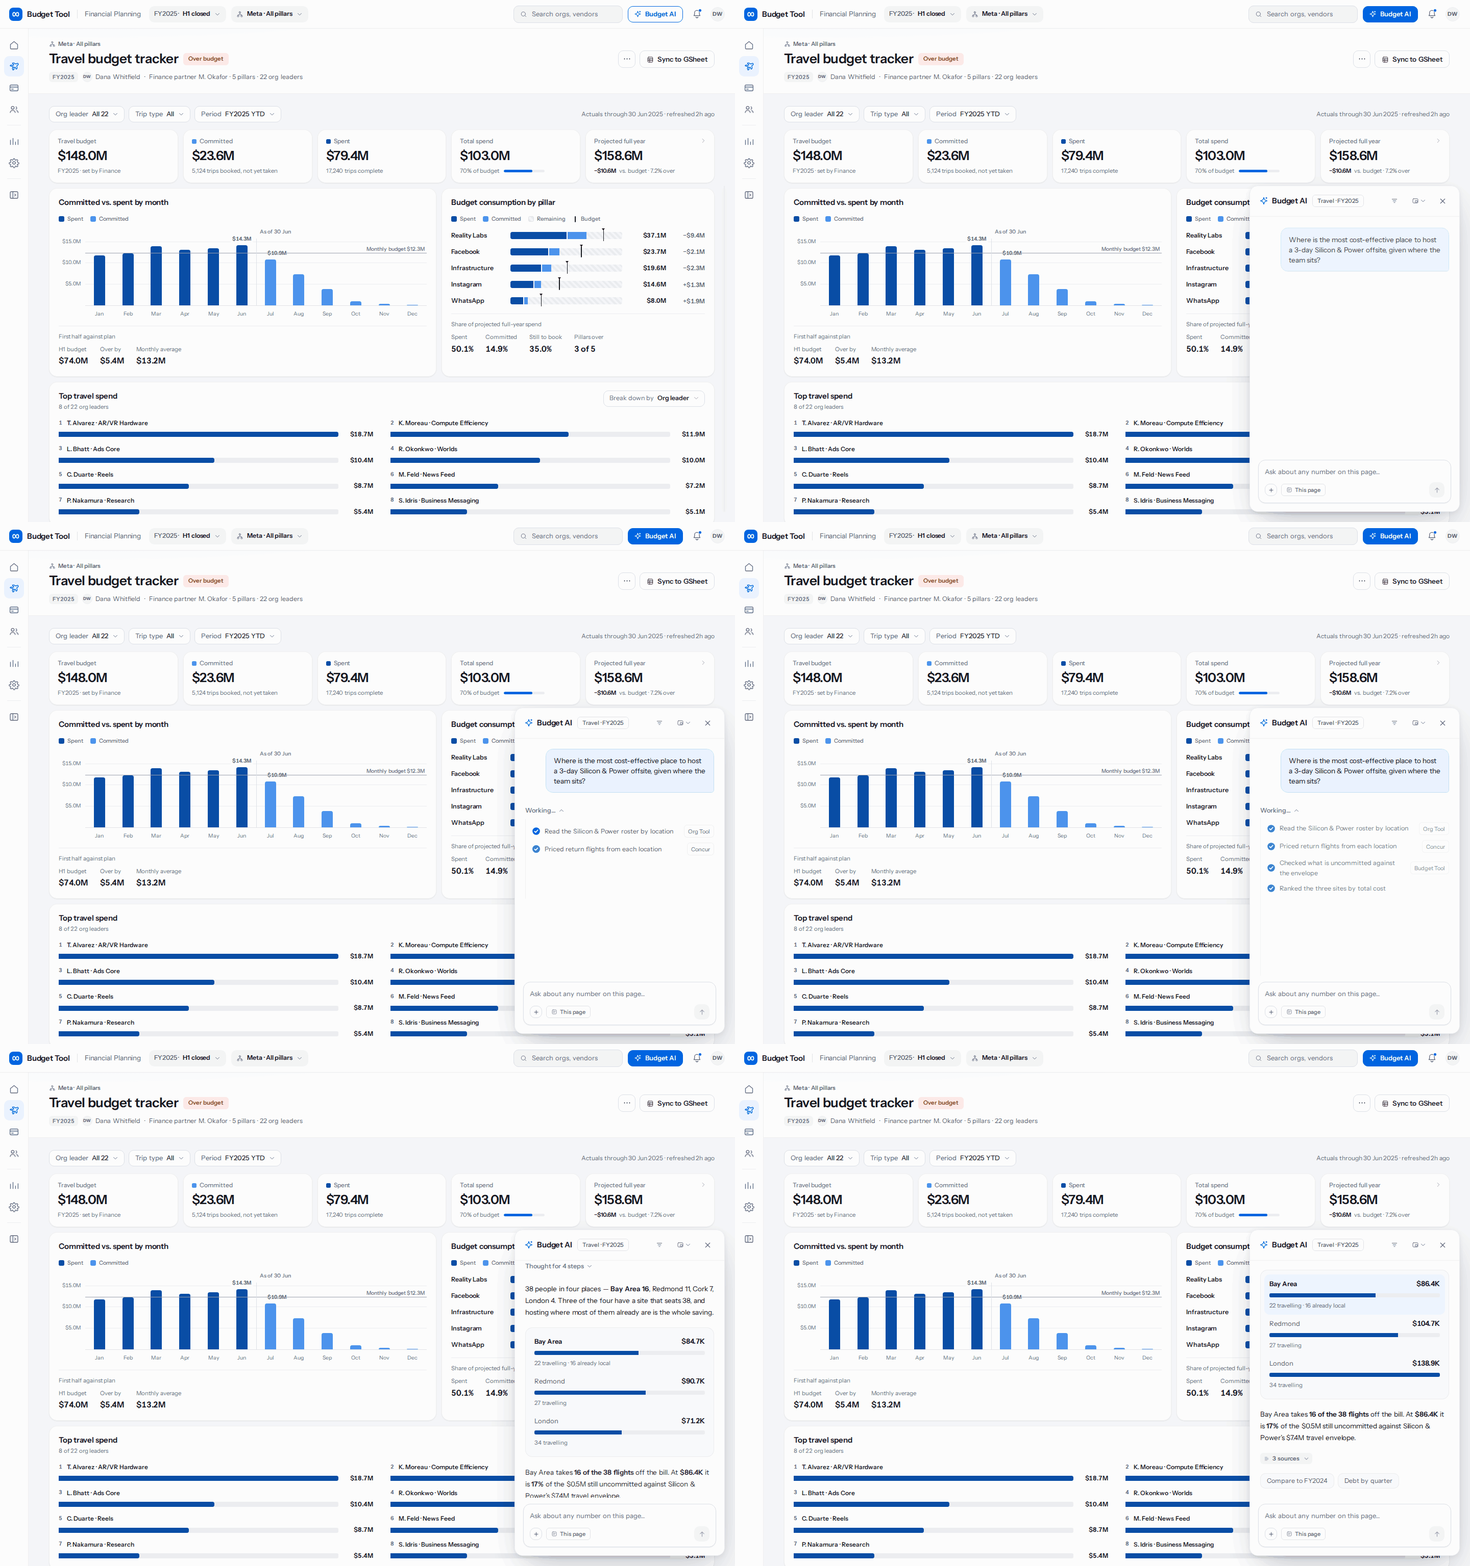 Illustrative data
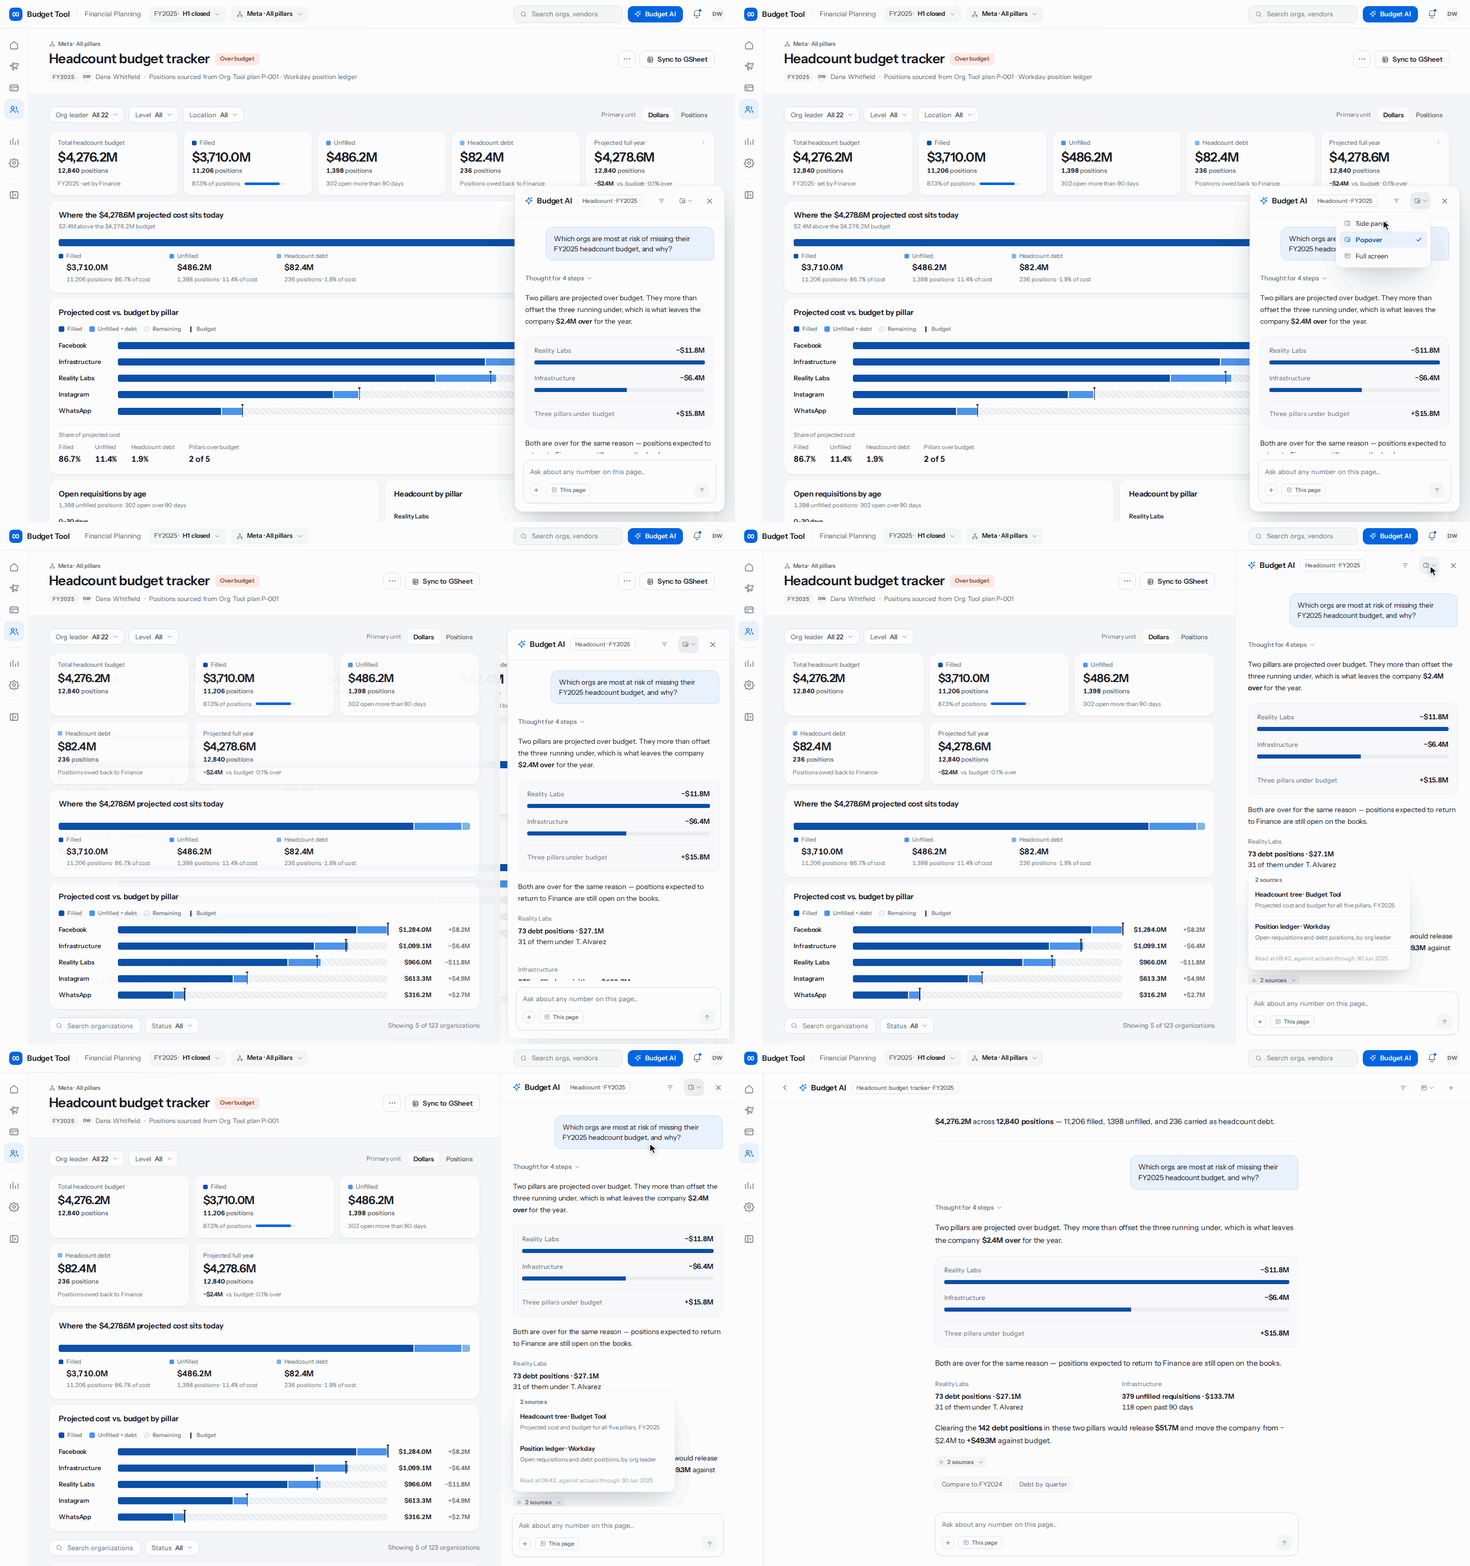 Illustrative data
I concept-tested with all three personas. Three findings changed the design.
Building a component library for product-specific elements to hold consistency. Leveraging AI inside the solution so people can decide and act faster. Designing for trust in both the data and the AI responses.
Find ways to make this a more personalized experience per persona and per organization. Stress-test terminology with every organization earlier in the process. Incorporate AI workflows from day one rather than layering them on later.
Before leaving Meta, I was co-leading exploration into an AI-first budget transformation: proactive anomaly detection that would flag a risk like a bad accrual before anyone thought to ask, autonomous budget management, and personalized dashboards tailored to how individual leaders plan.
I designed this work in code rather than Figma, using Claude Code inside VS Code, and merged my own changes into the product. Working directly in the running system meant every exploration was real and testable the same day, with no gap between a mockup and something the team could actually put in front of a budget owner.
This work sits at the intersection of making complex systems feel simple and operating at the strategic layer where product direction is set. Building these budget trackers from scratch required deep engineering collaboration and close partnership with Finance. Layering high-stakes AI trust models on top of that foundation represents some of the most forward-looking work of my career.