 Illustrative data
Illustrative data: every figure, name, and org shown in these screens is fabricated. See the full NDA note below.
Internal tools for headcount planning, debt management, and org restructuring, used by org leaders, Finance, and HR teams across Meta.
Illustrative dataIllustrative data: every figure, name, and org shown in these screens is fabricated. See the full NDA note below.
Meta shifted annual headcount planning from tracking positions to tracking dollars, bringing Finance in as a stakeholder for the first time in a process previously owned by HR and org leaders alone.
Headcount tracked in positions only (no dollar visibility); Finance absent; static spreadsheets that quickly went stale; weeks of back-and-forth per cycle; no single source of truth.
Finance integrated as a core stakeholder; compensation data highly sensitive (tied to levels, locations, and roles); org leaders responsible for financial decisions alongside headcount (two distinct cognitive loads); complex permission architecture required.
Build the first company-wide tool where org leaders, Finance, and Mission Control plan headcount in dollars together, from goal setting through approval to publishing into live systems.



Dollar values tied to levels, locations, and roles required airtight architecture to prevent data leaks.
Designing for Finance's mental model without disrupting how org leaders and HR already worked.
Helping a massive organization change how it thinks about planning, requiring proactive design leadership.
This was fundamentally an organizational-change problem, not just a UI problem. Instead of executing on a handed-down spec, I used journey maps to make a critical tension visible: org leaders now had two distinct cognitive tasks (headcount and dollars) they had never had to hold at once. Seeing that tension mapped out drove the decision to keep decisions integrated in a single view rather than splitting tools, and to architect permissions around who could see each half.
As the sole product designer on a team of 18 engineers, 1 PM, 3 business partners, a content designer, and a UX researcher, I stayed embedded in strategy rooms before requirements were written, creating shared user journeys and defining JTBD to drive cross-functional alignment. I also ran a standing feedback loop with our own org leadership, so I had a live org leader point of view in the room rather than only in research sessions.
Her ability to juggle dozens of requirements docs, chats, Tasks, spreadsheets, Figmas and pull out the core information needed from each XFN is an incredible feat. Without that level of prioritization and partnering, the Workforce Planning projects would have been absolute chaos.
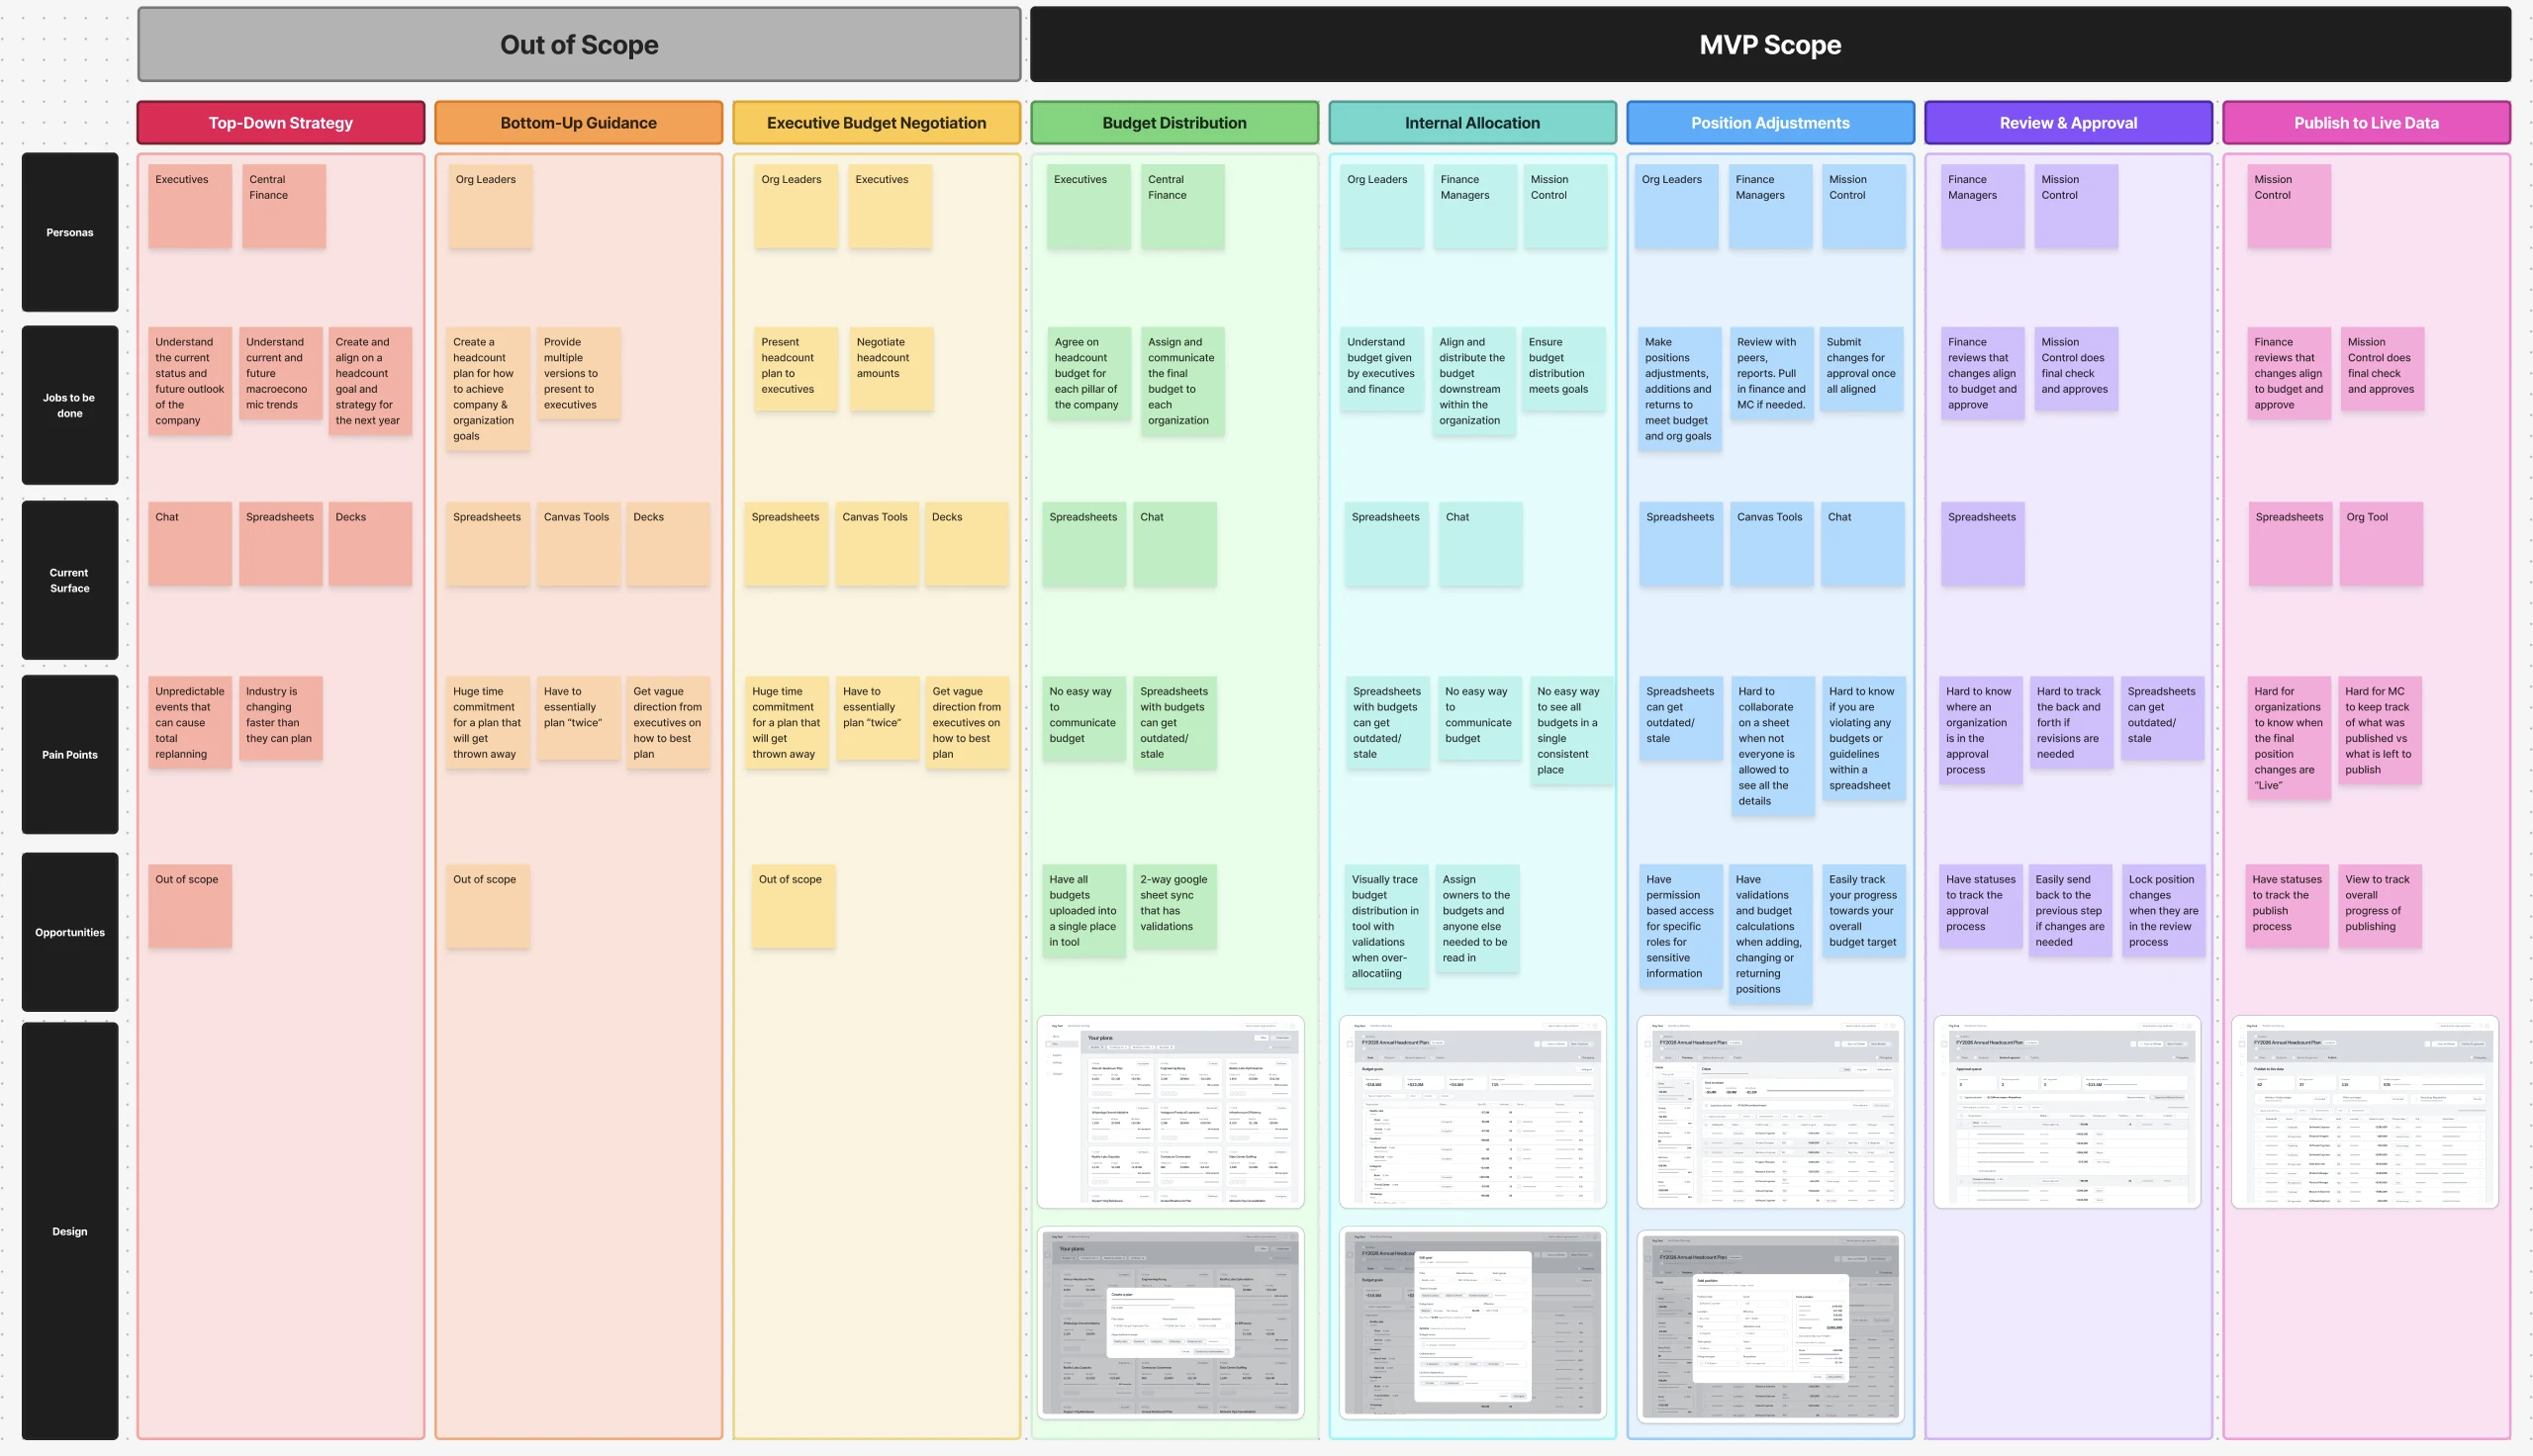
Content Designer, MetaAnnual planning is a long, multi-player workflow, and the cycle would not wait. Rather than build something thin across all of it, I prioritized the stages where all three roles collided and left the rest out of the MVP.
Everything I kept was a place where org leaders, Finance, and Mission Control had to act on the same plan at the same time. What I cut happened before the plan existed, or in rooms a tool was not going to change.
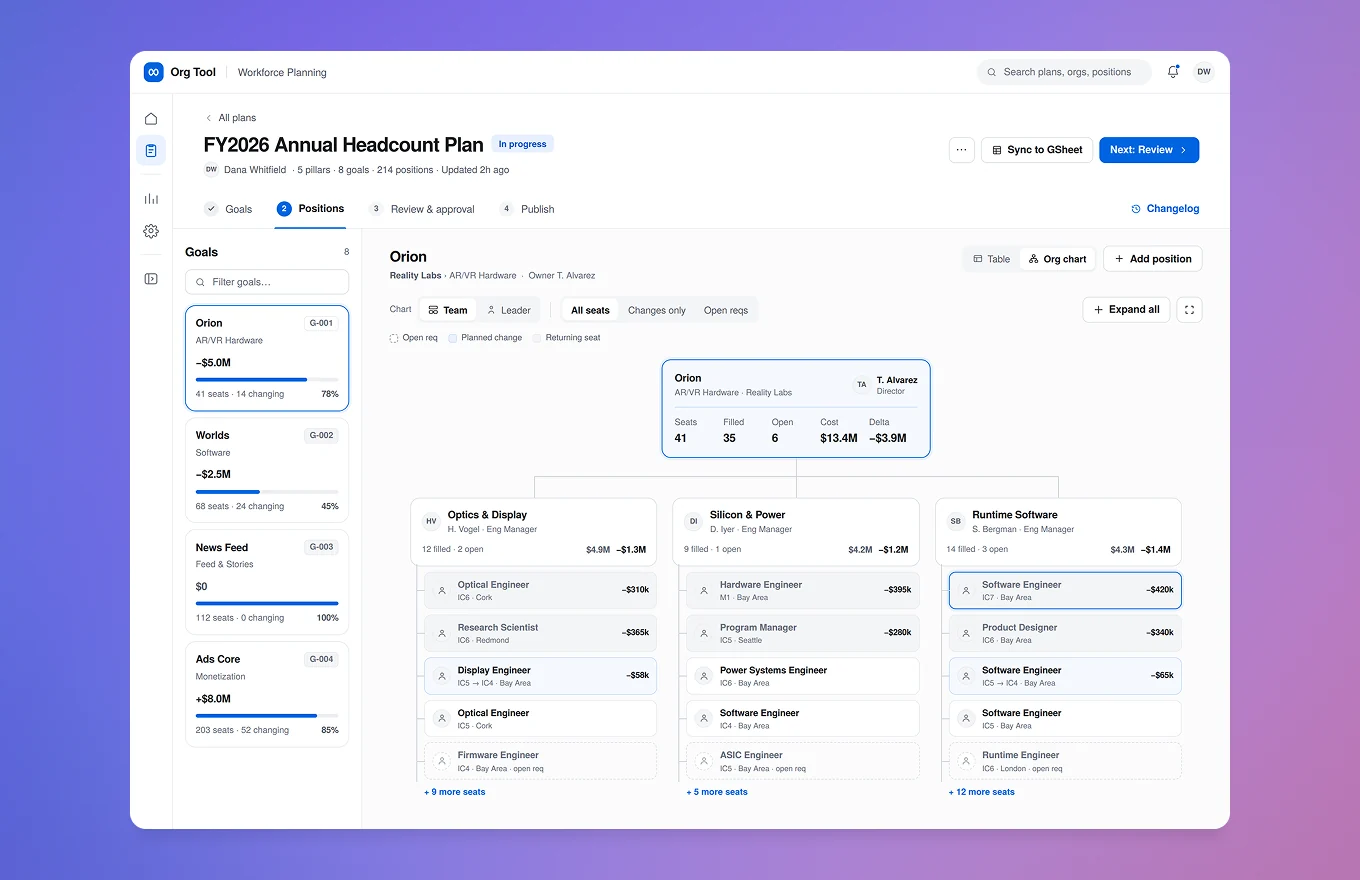
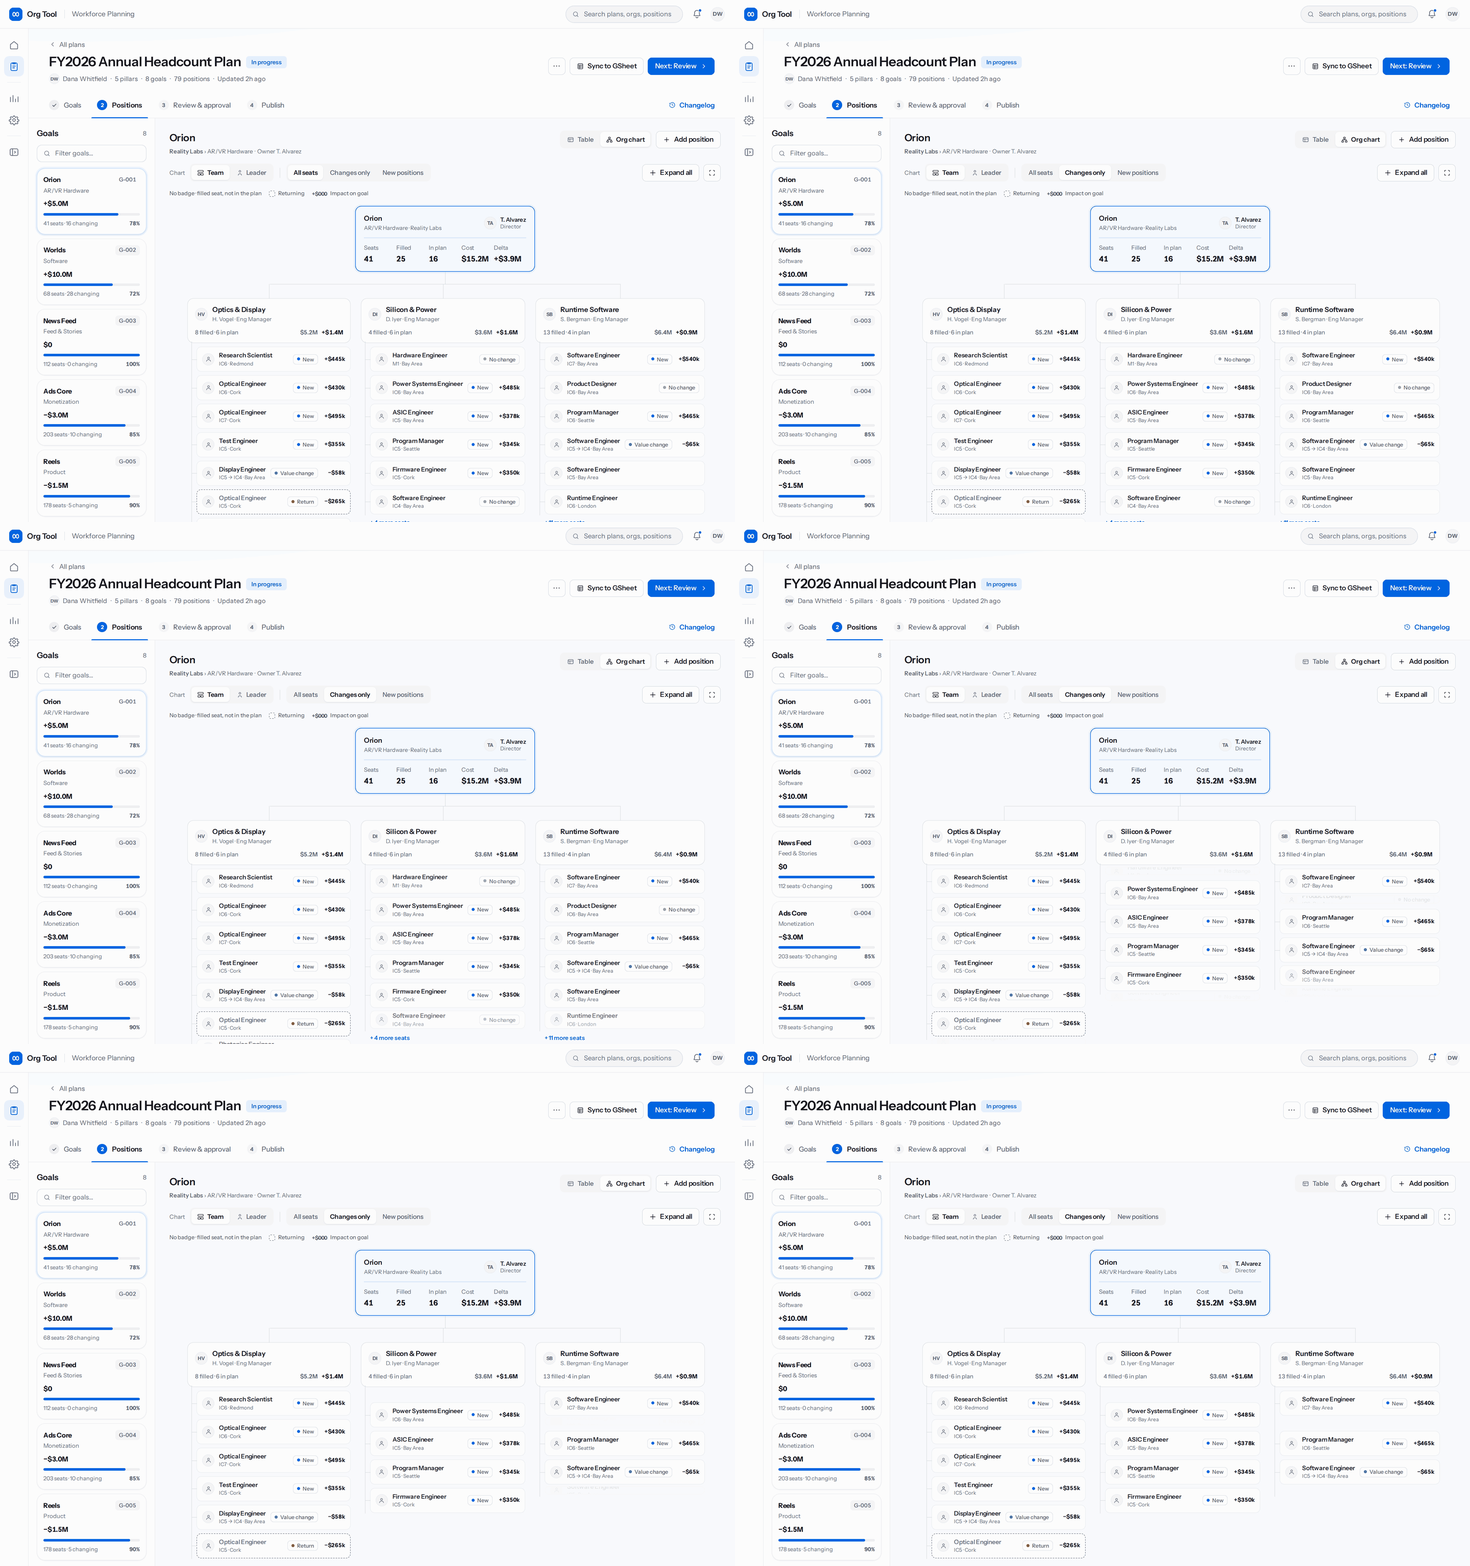
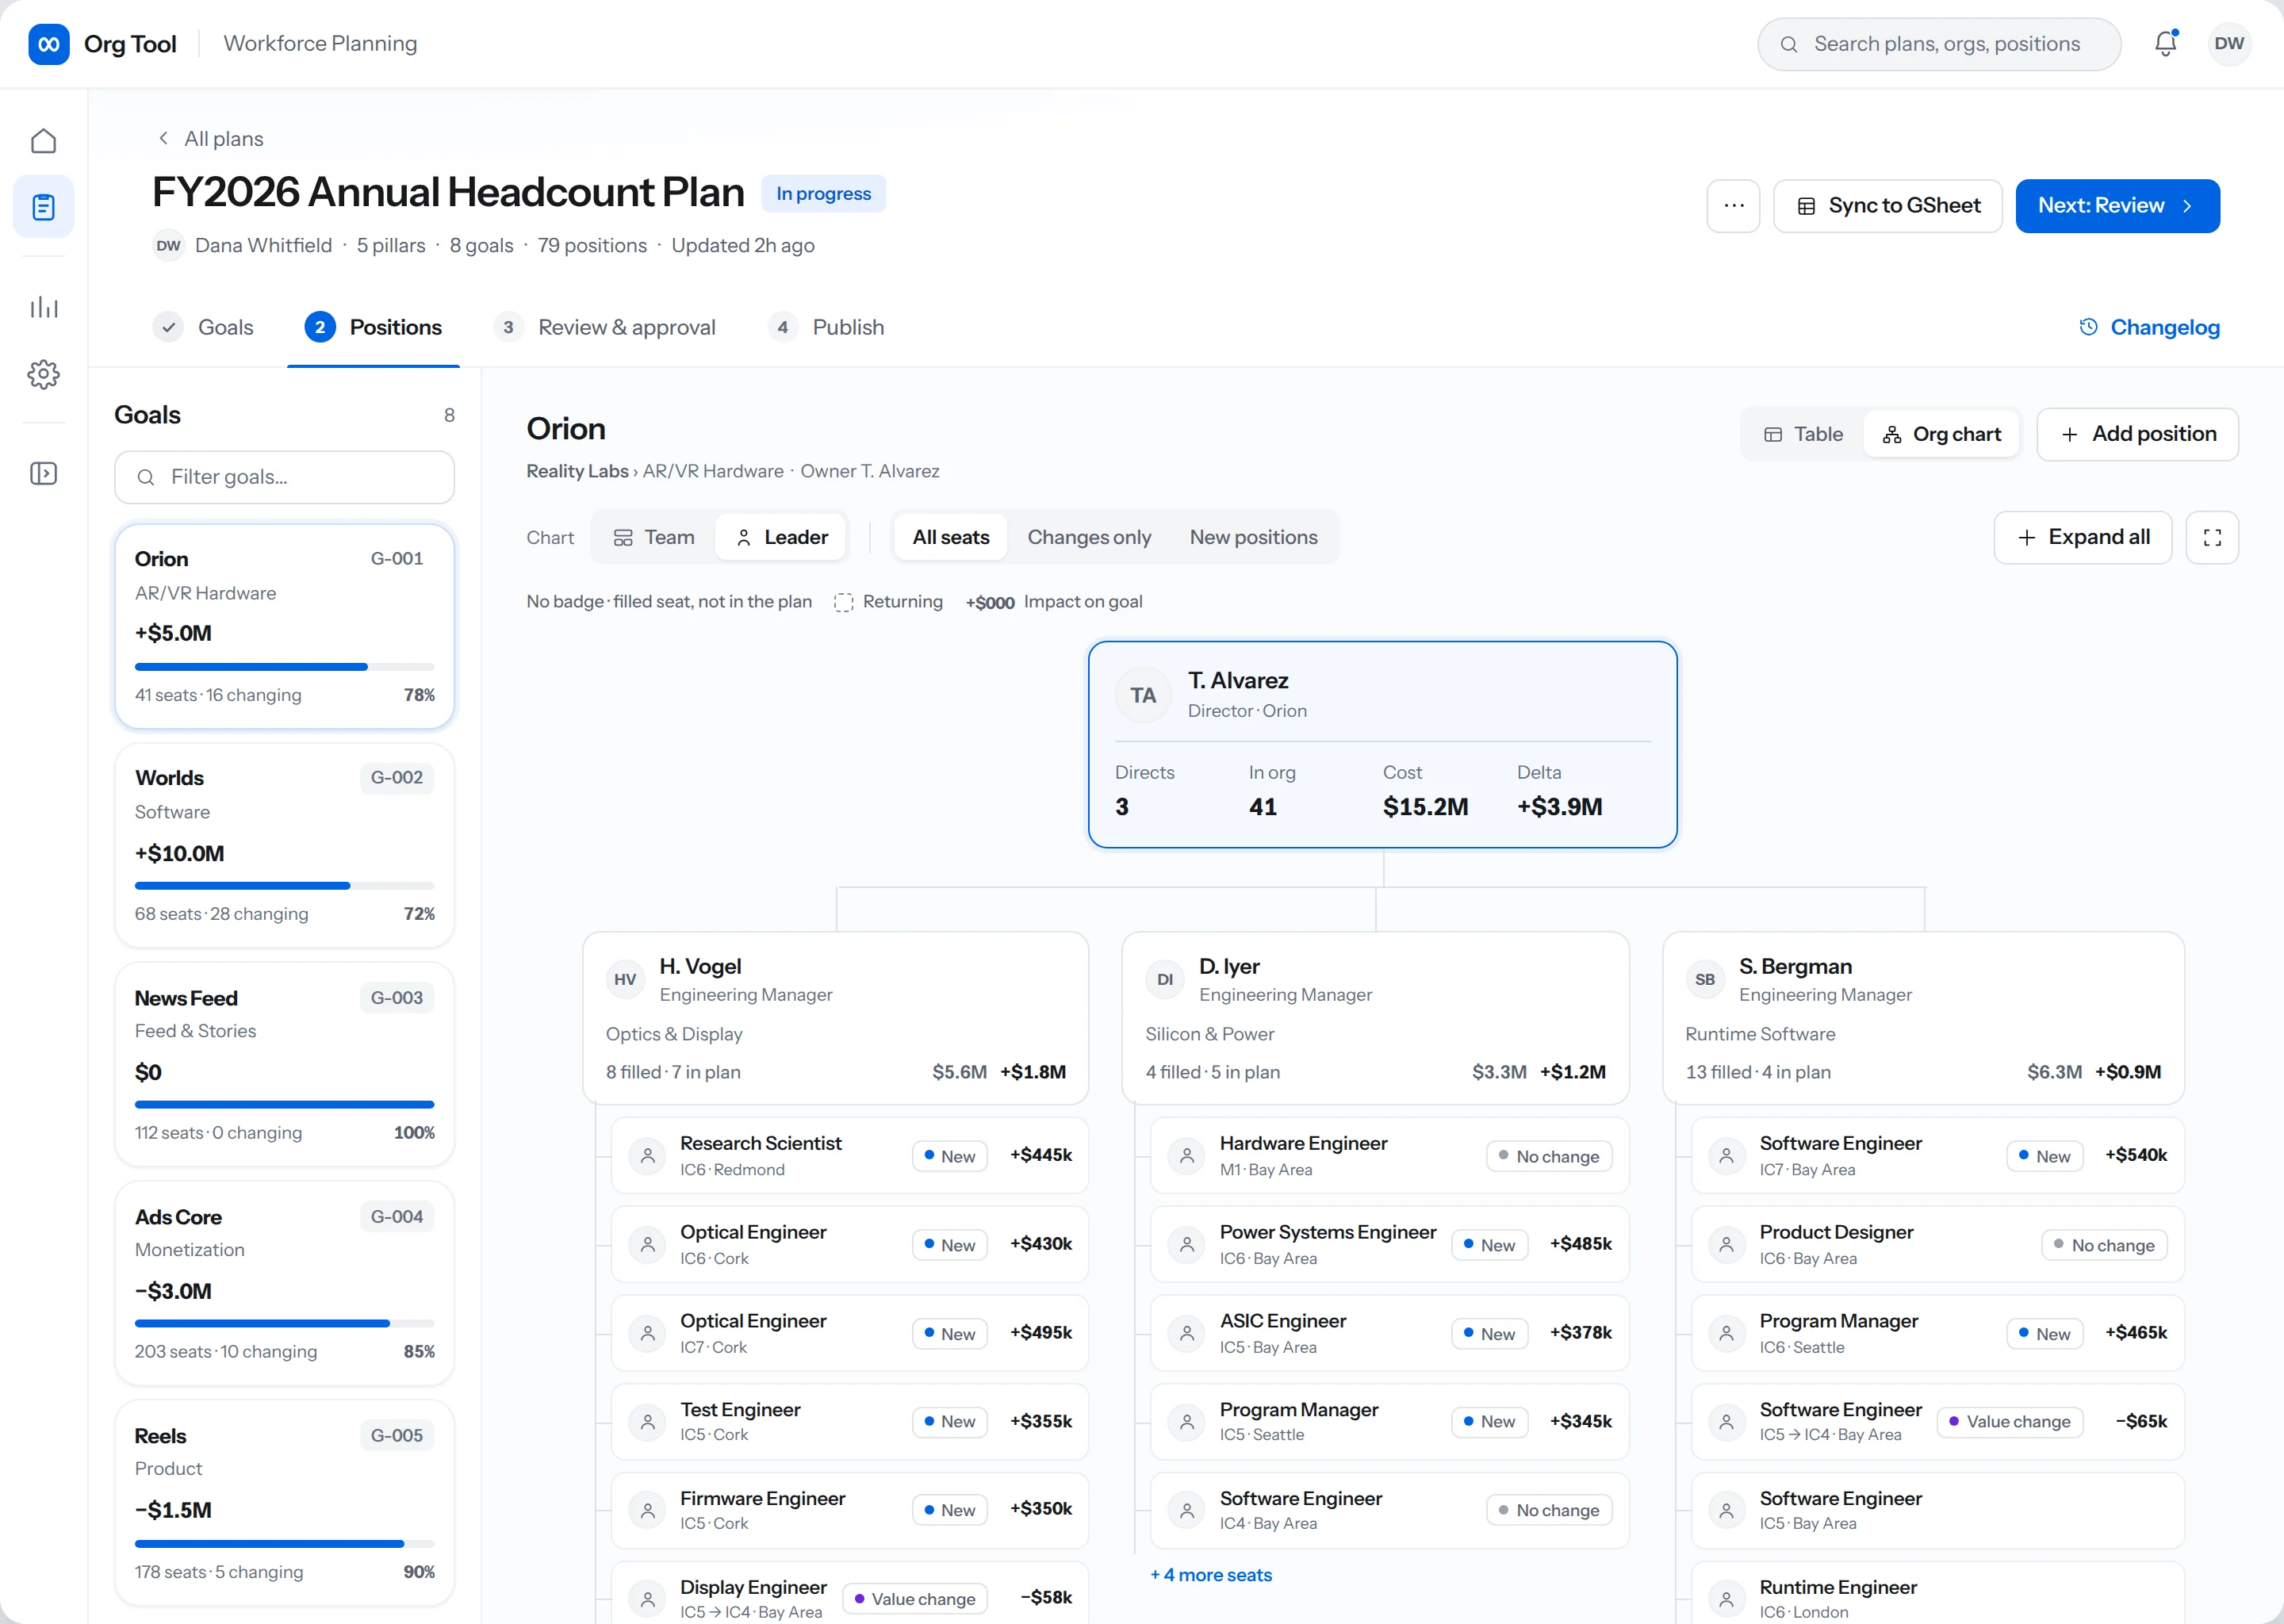
The other tradeoff was structural. Raw tables matched how Finance works, not how org leaders do, and testing made that gap obvious. Org leader feedback drove an integrated org chart view before launch, so the same plan could be read as a table or as an organization.
Rather than building a separate tool for each kind of plan, we built one platform. Underneath, every plan is made of the same three moves:
I led design on each of the four:
What separates the four plan types is which of those moves each one allows.
| Change type | Annual plan | Reorg | Debt payback | Contingency |
|---|---|---|---|---|
| Add | Allowed | Not allowed | Not allowed | Allowed |
| Value change | Allowed | Allowed | Not allowed | Allowed |
| Return to Finance | Allowed | Allowed | Allowed | Not allowed |
One system, with a different set of permissions on the same three actions. Contingency never returns a position, because its whole purpose is growth; debt payback only returns, because that is what paying down debt is.
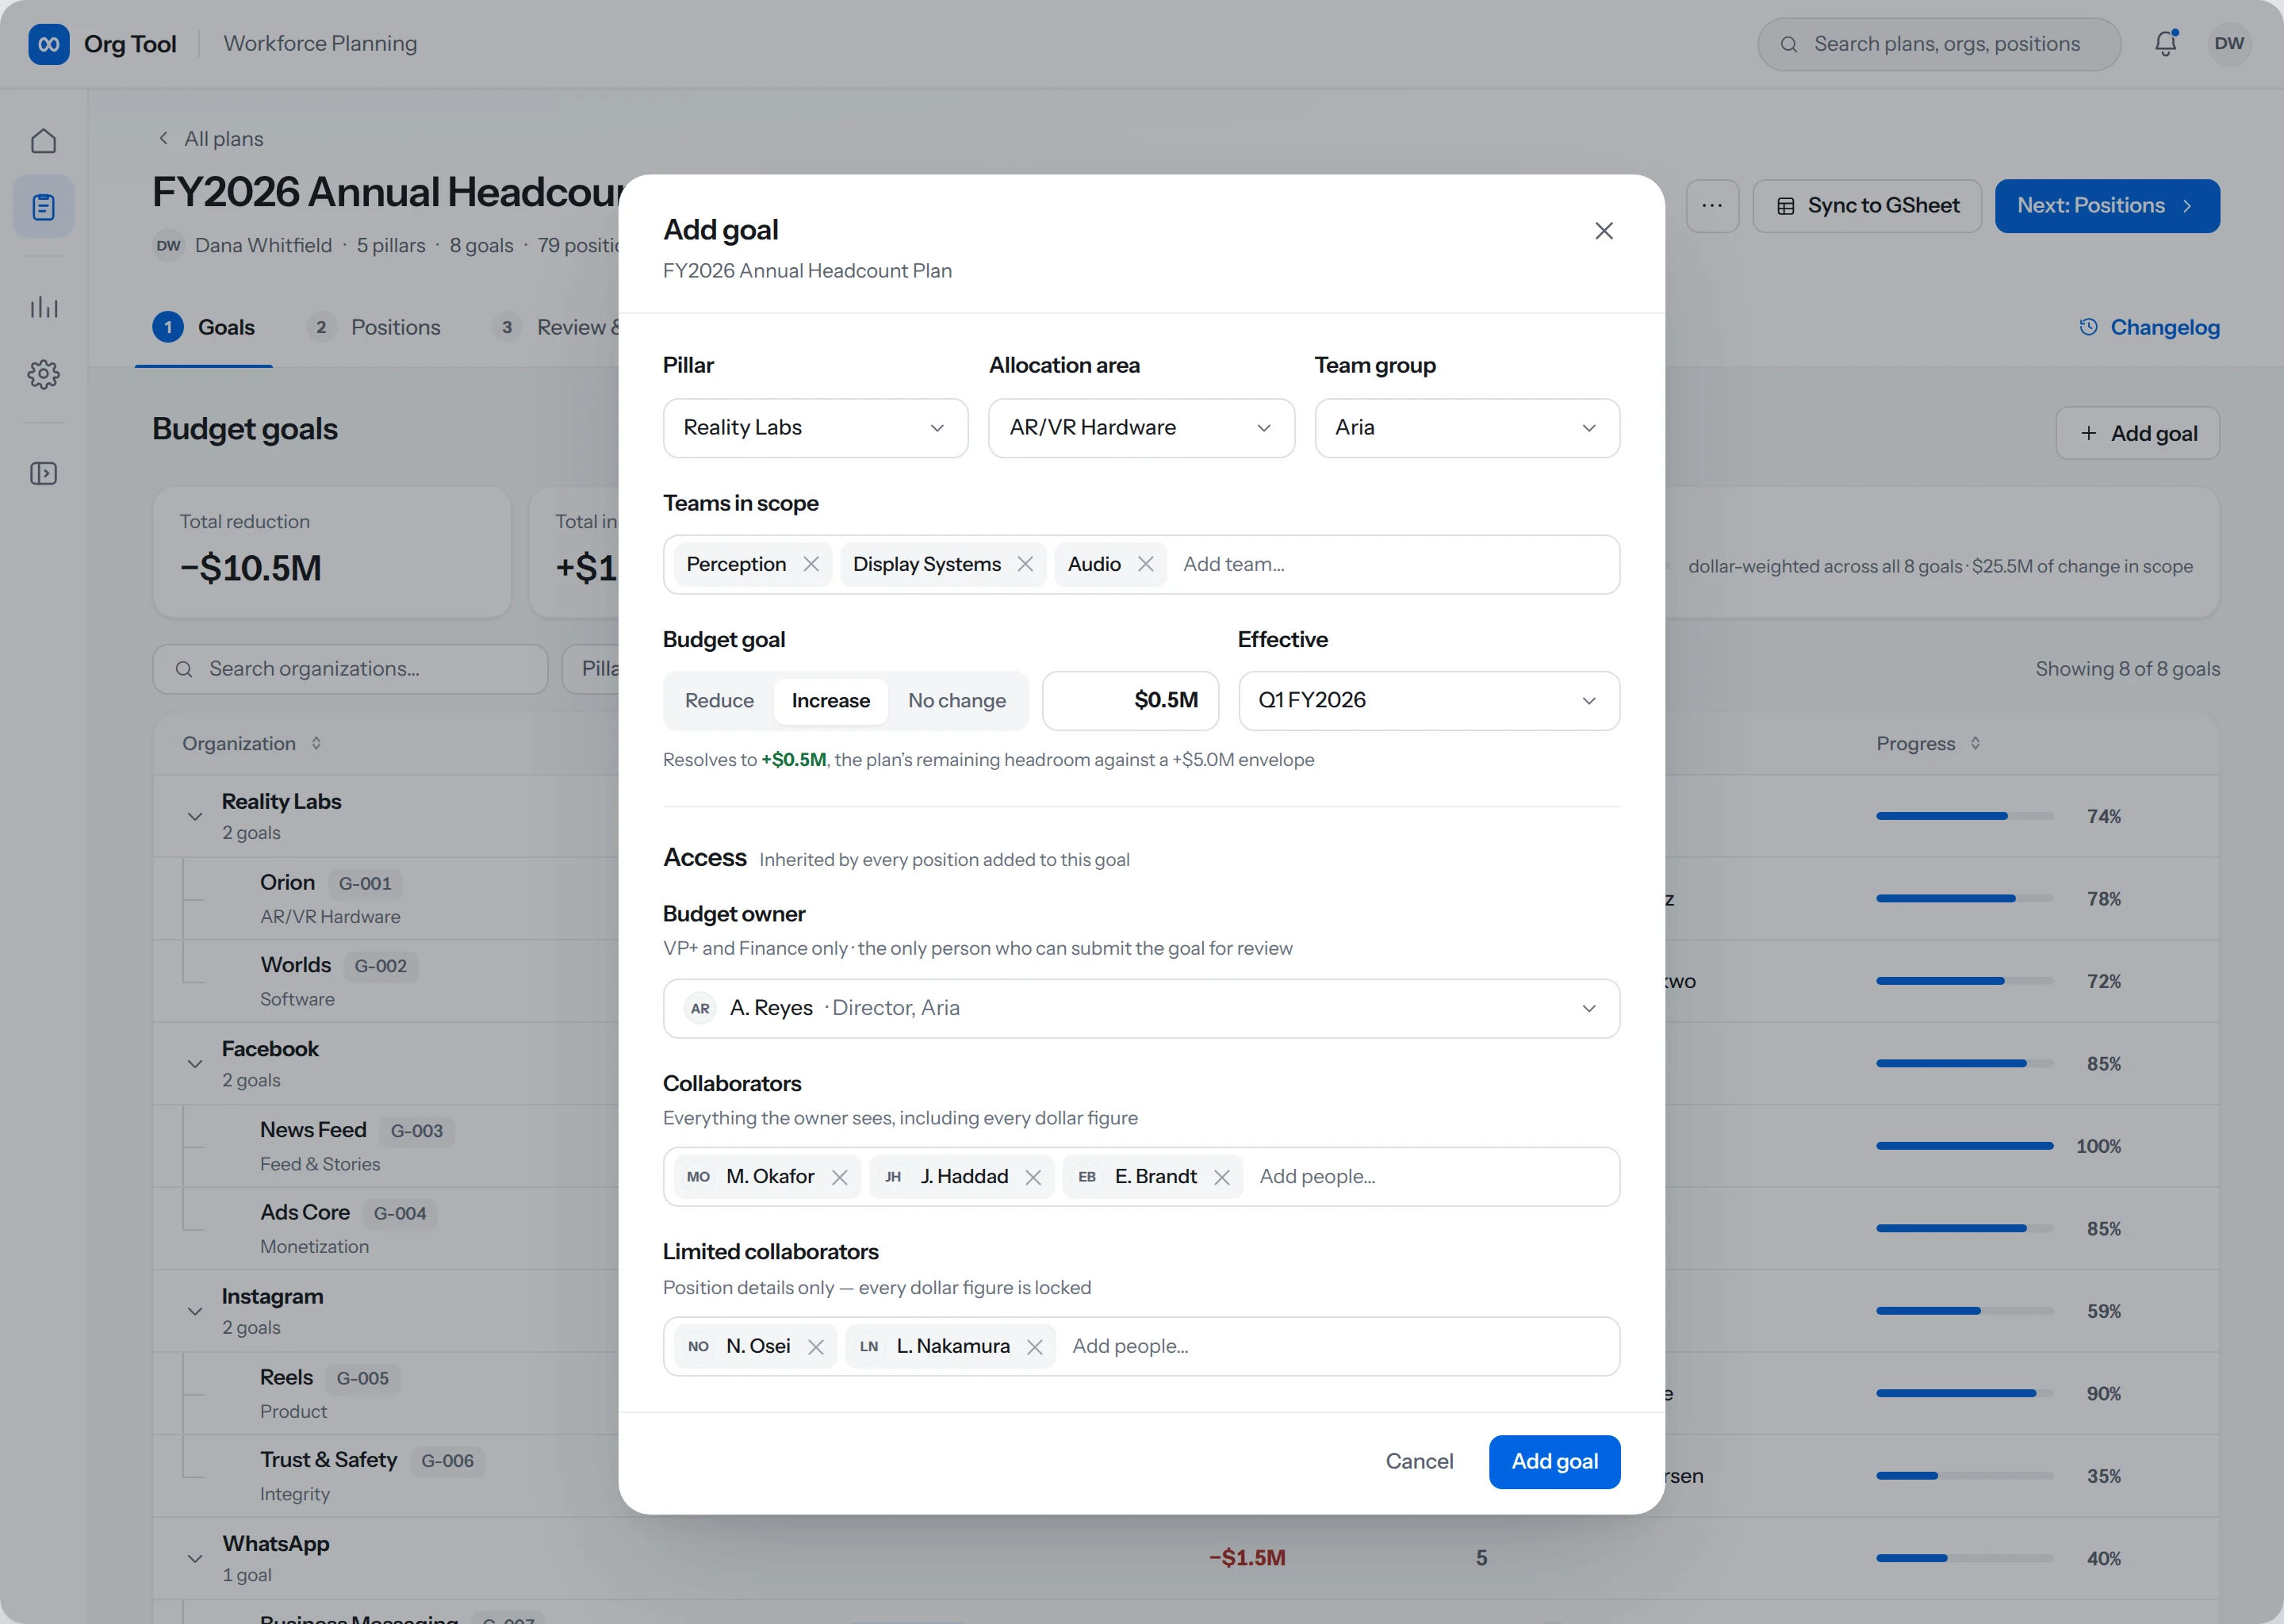
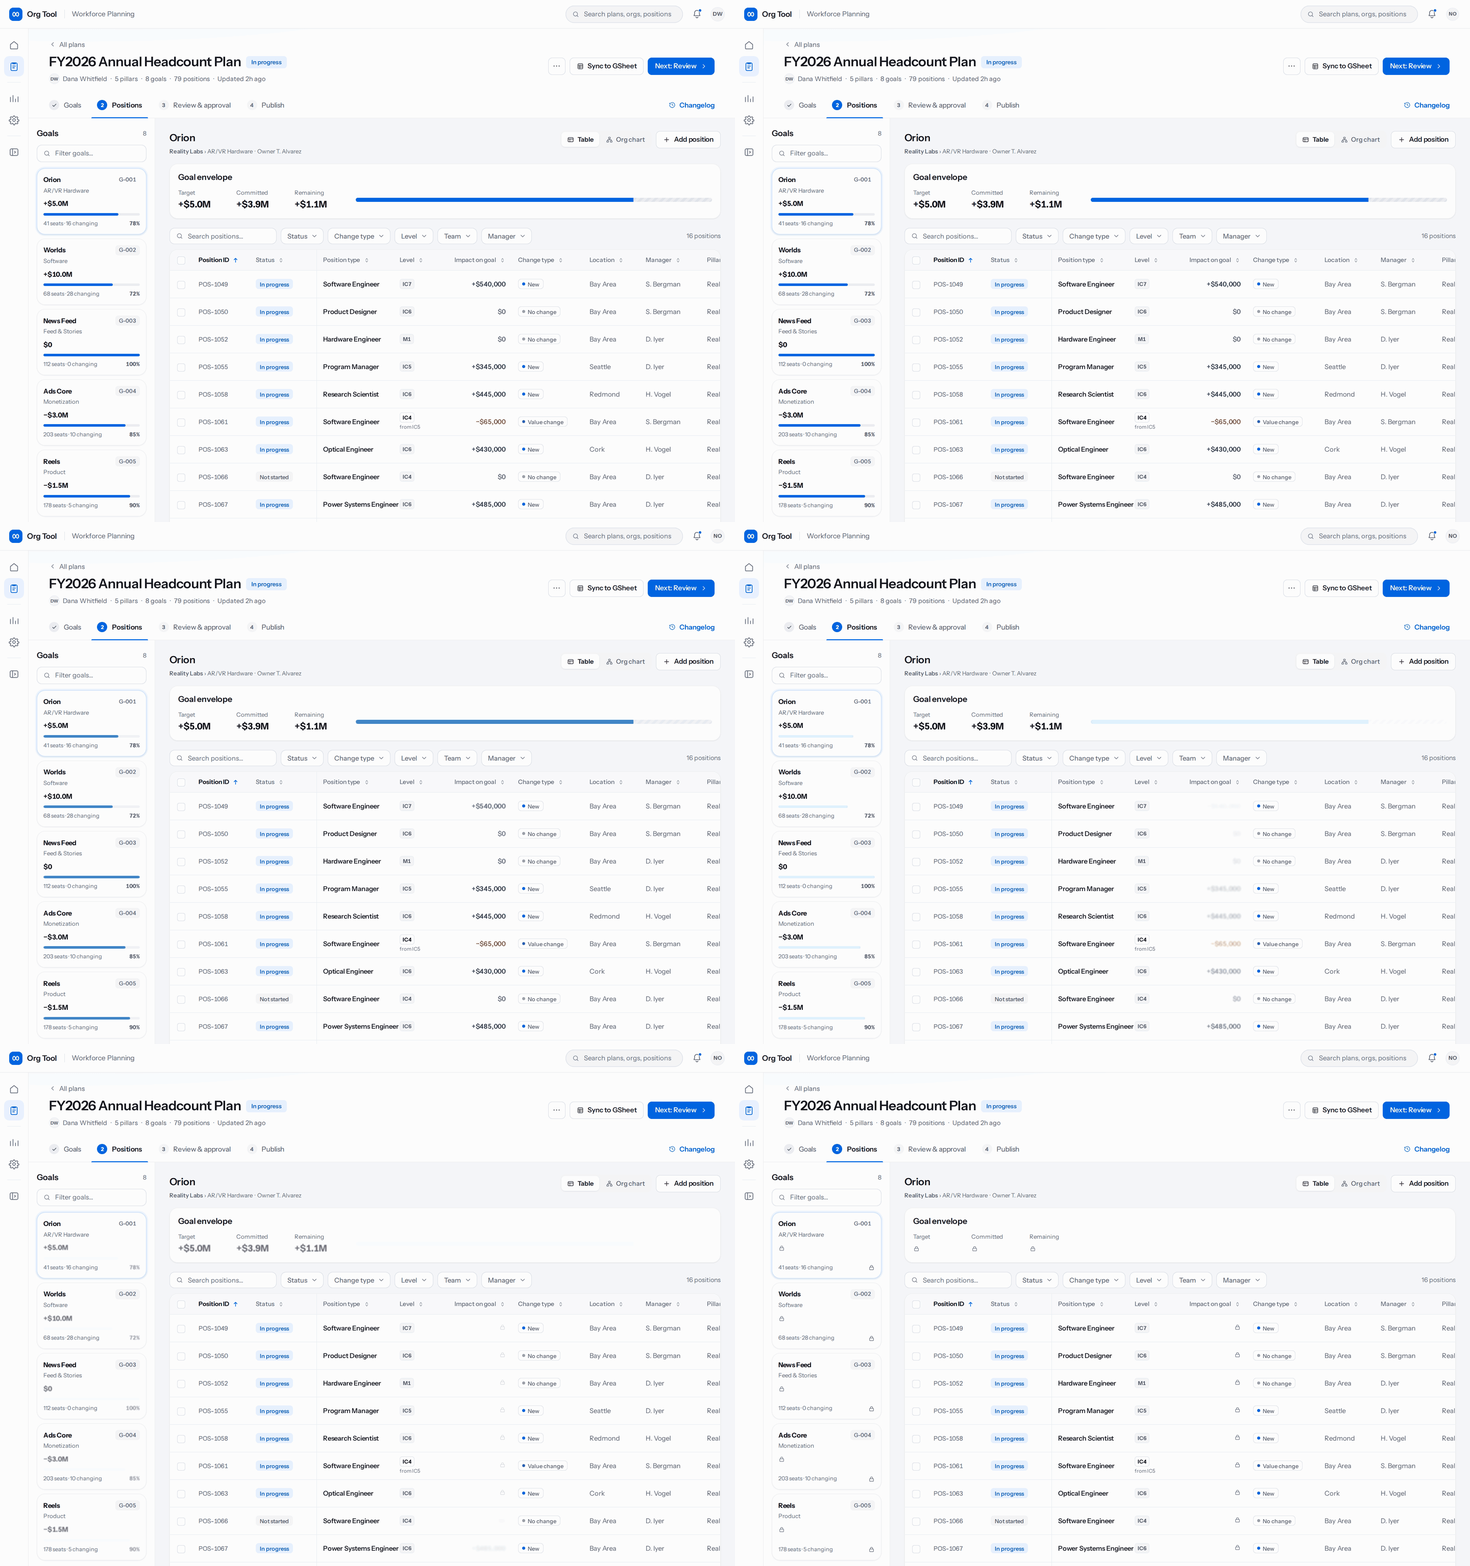
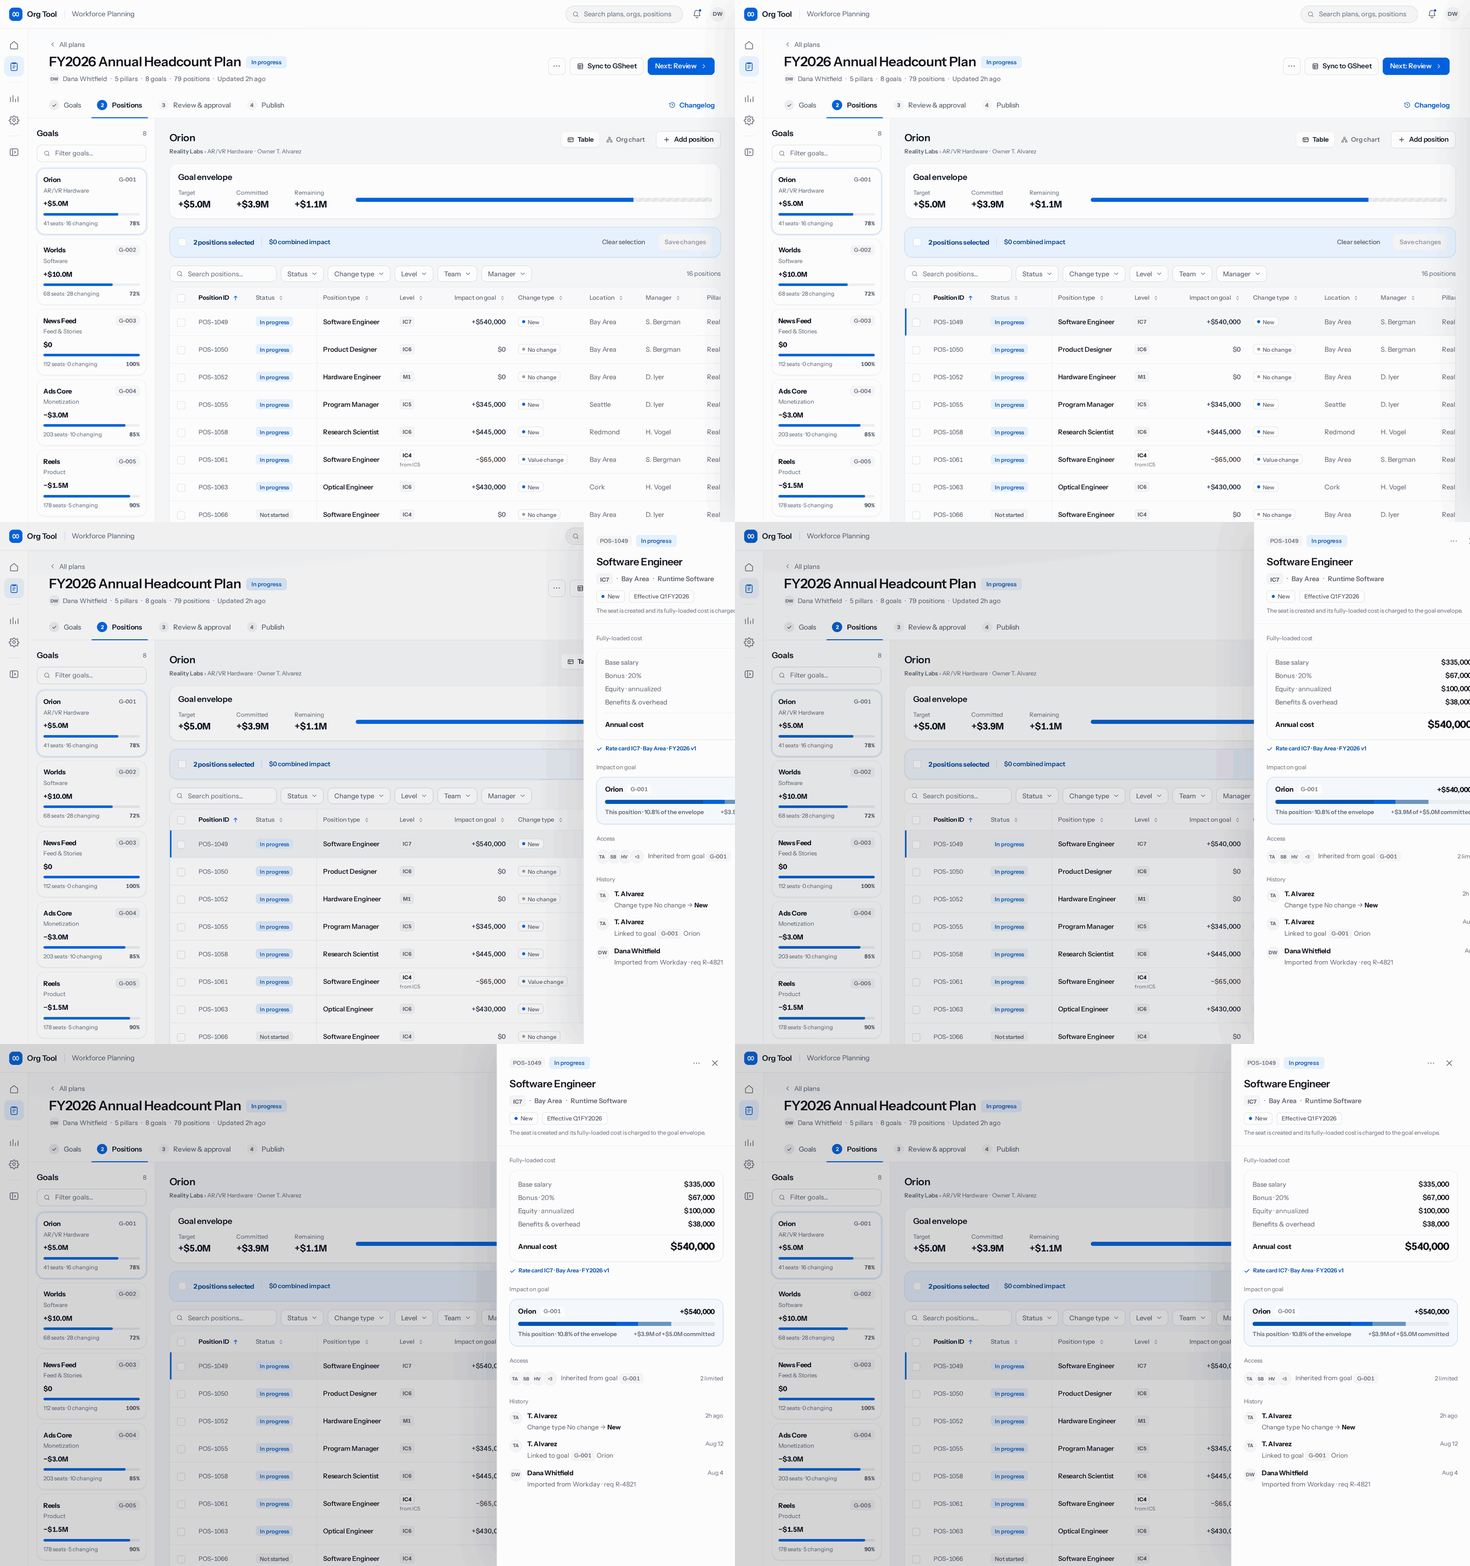
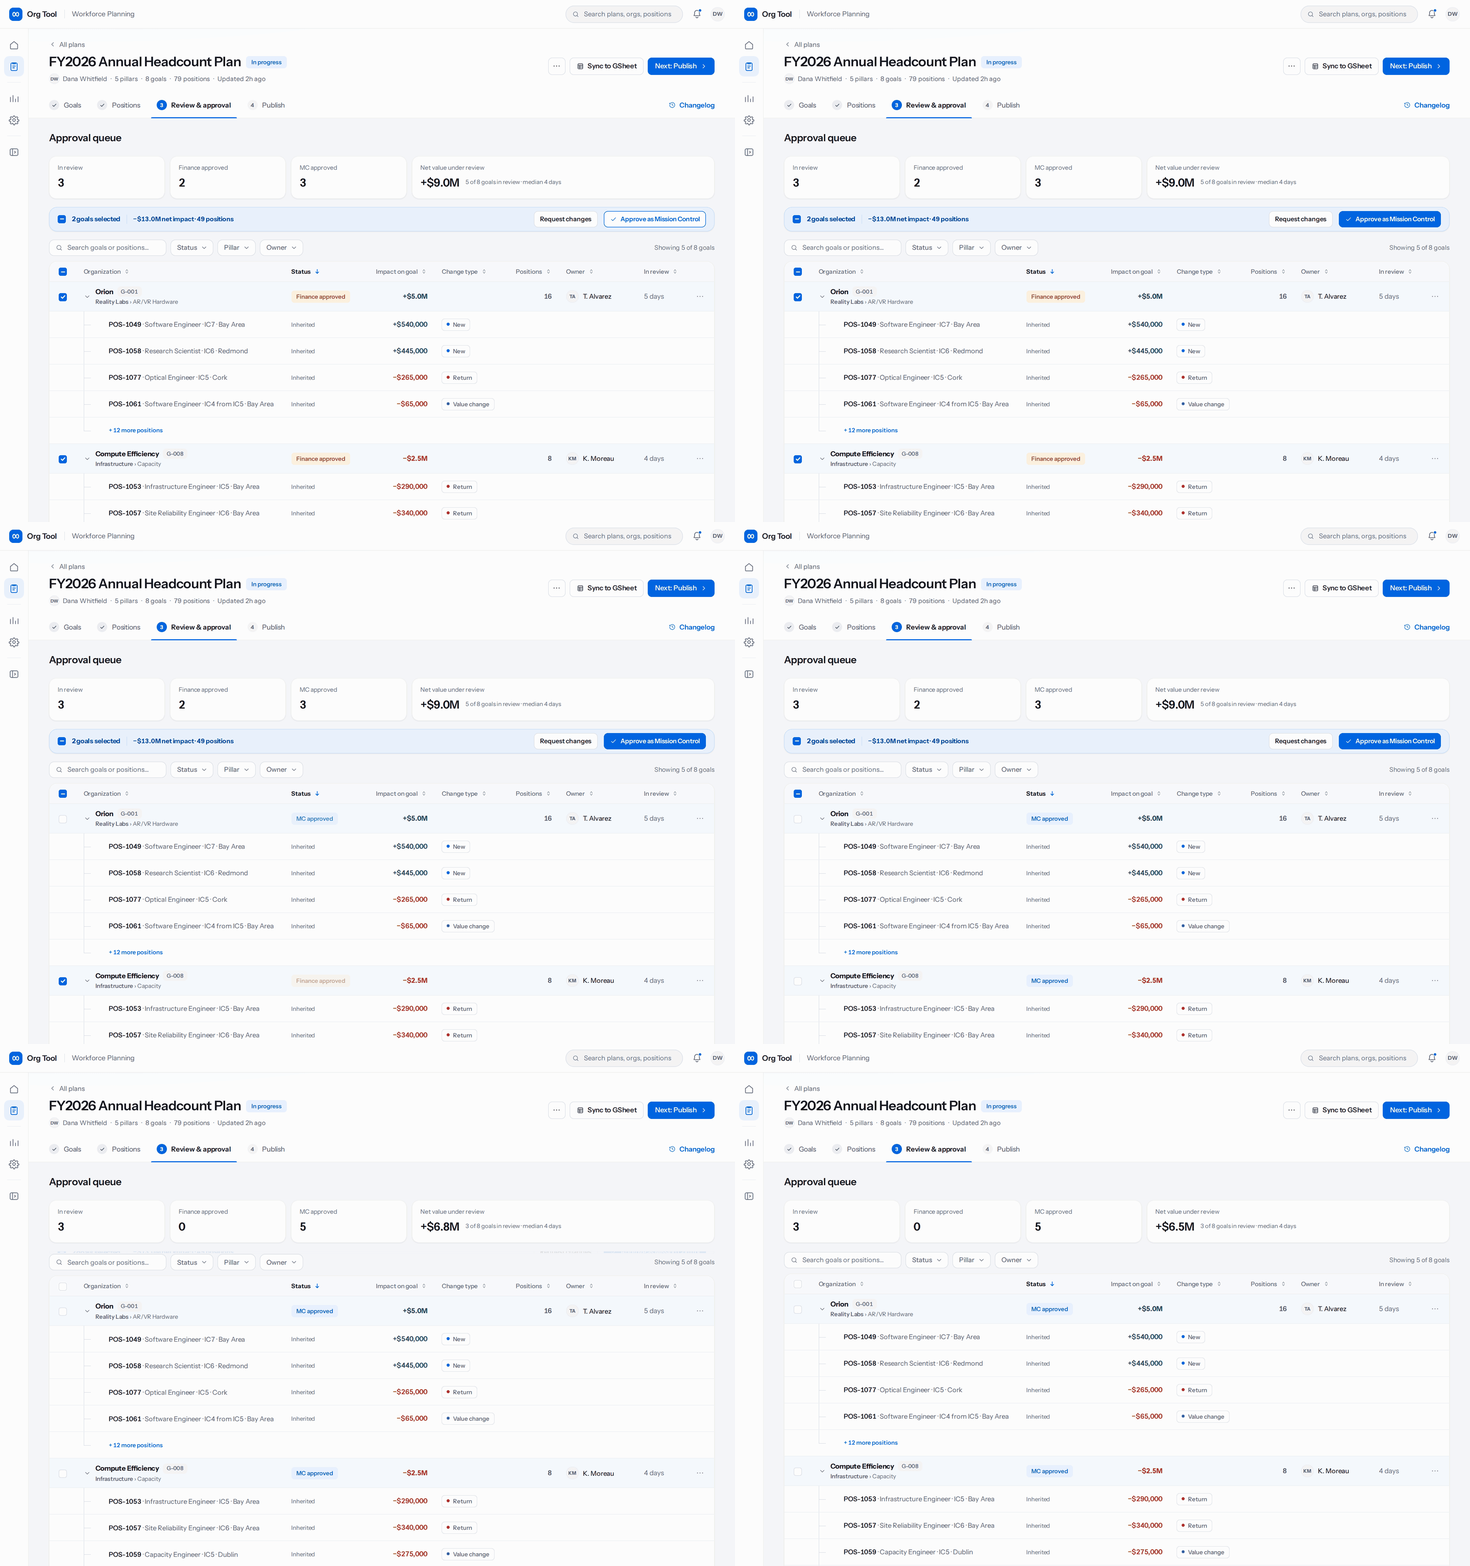
Access was the hardest structural problem underneath all of them. A single plan spanned pillars with different budget owners, so permission had to be granted per goal rather than per plan, then inherited by every position inside it. Three roles:
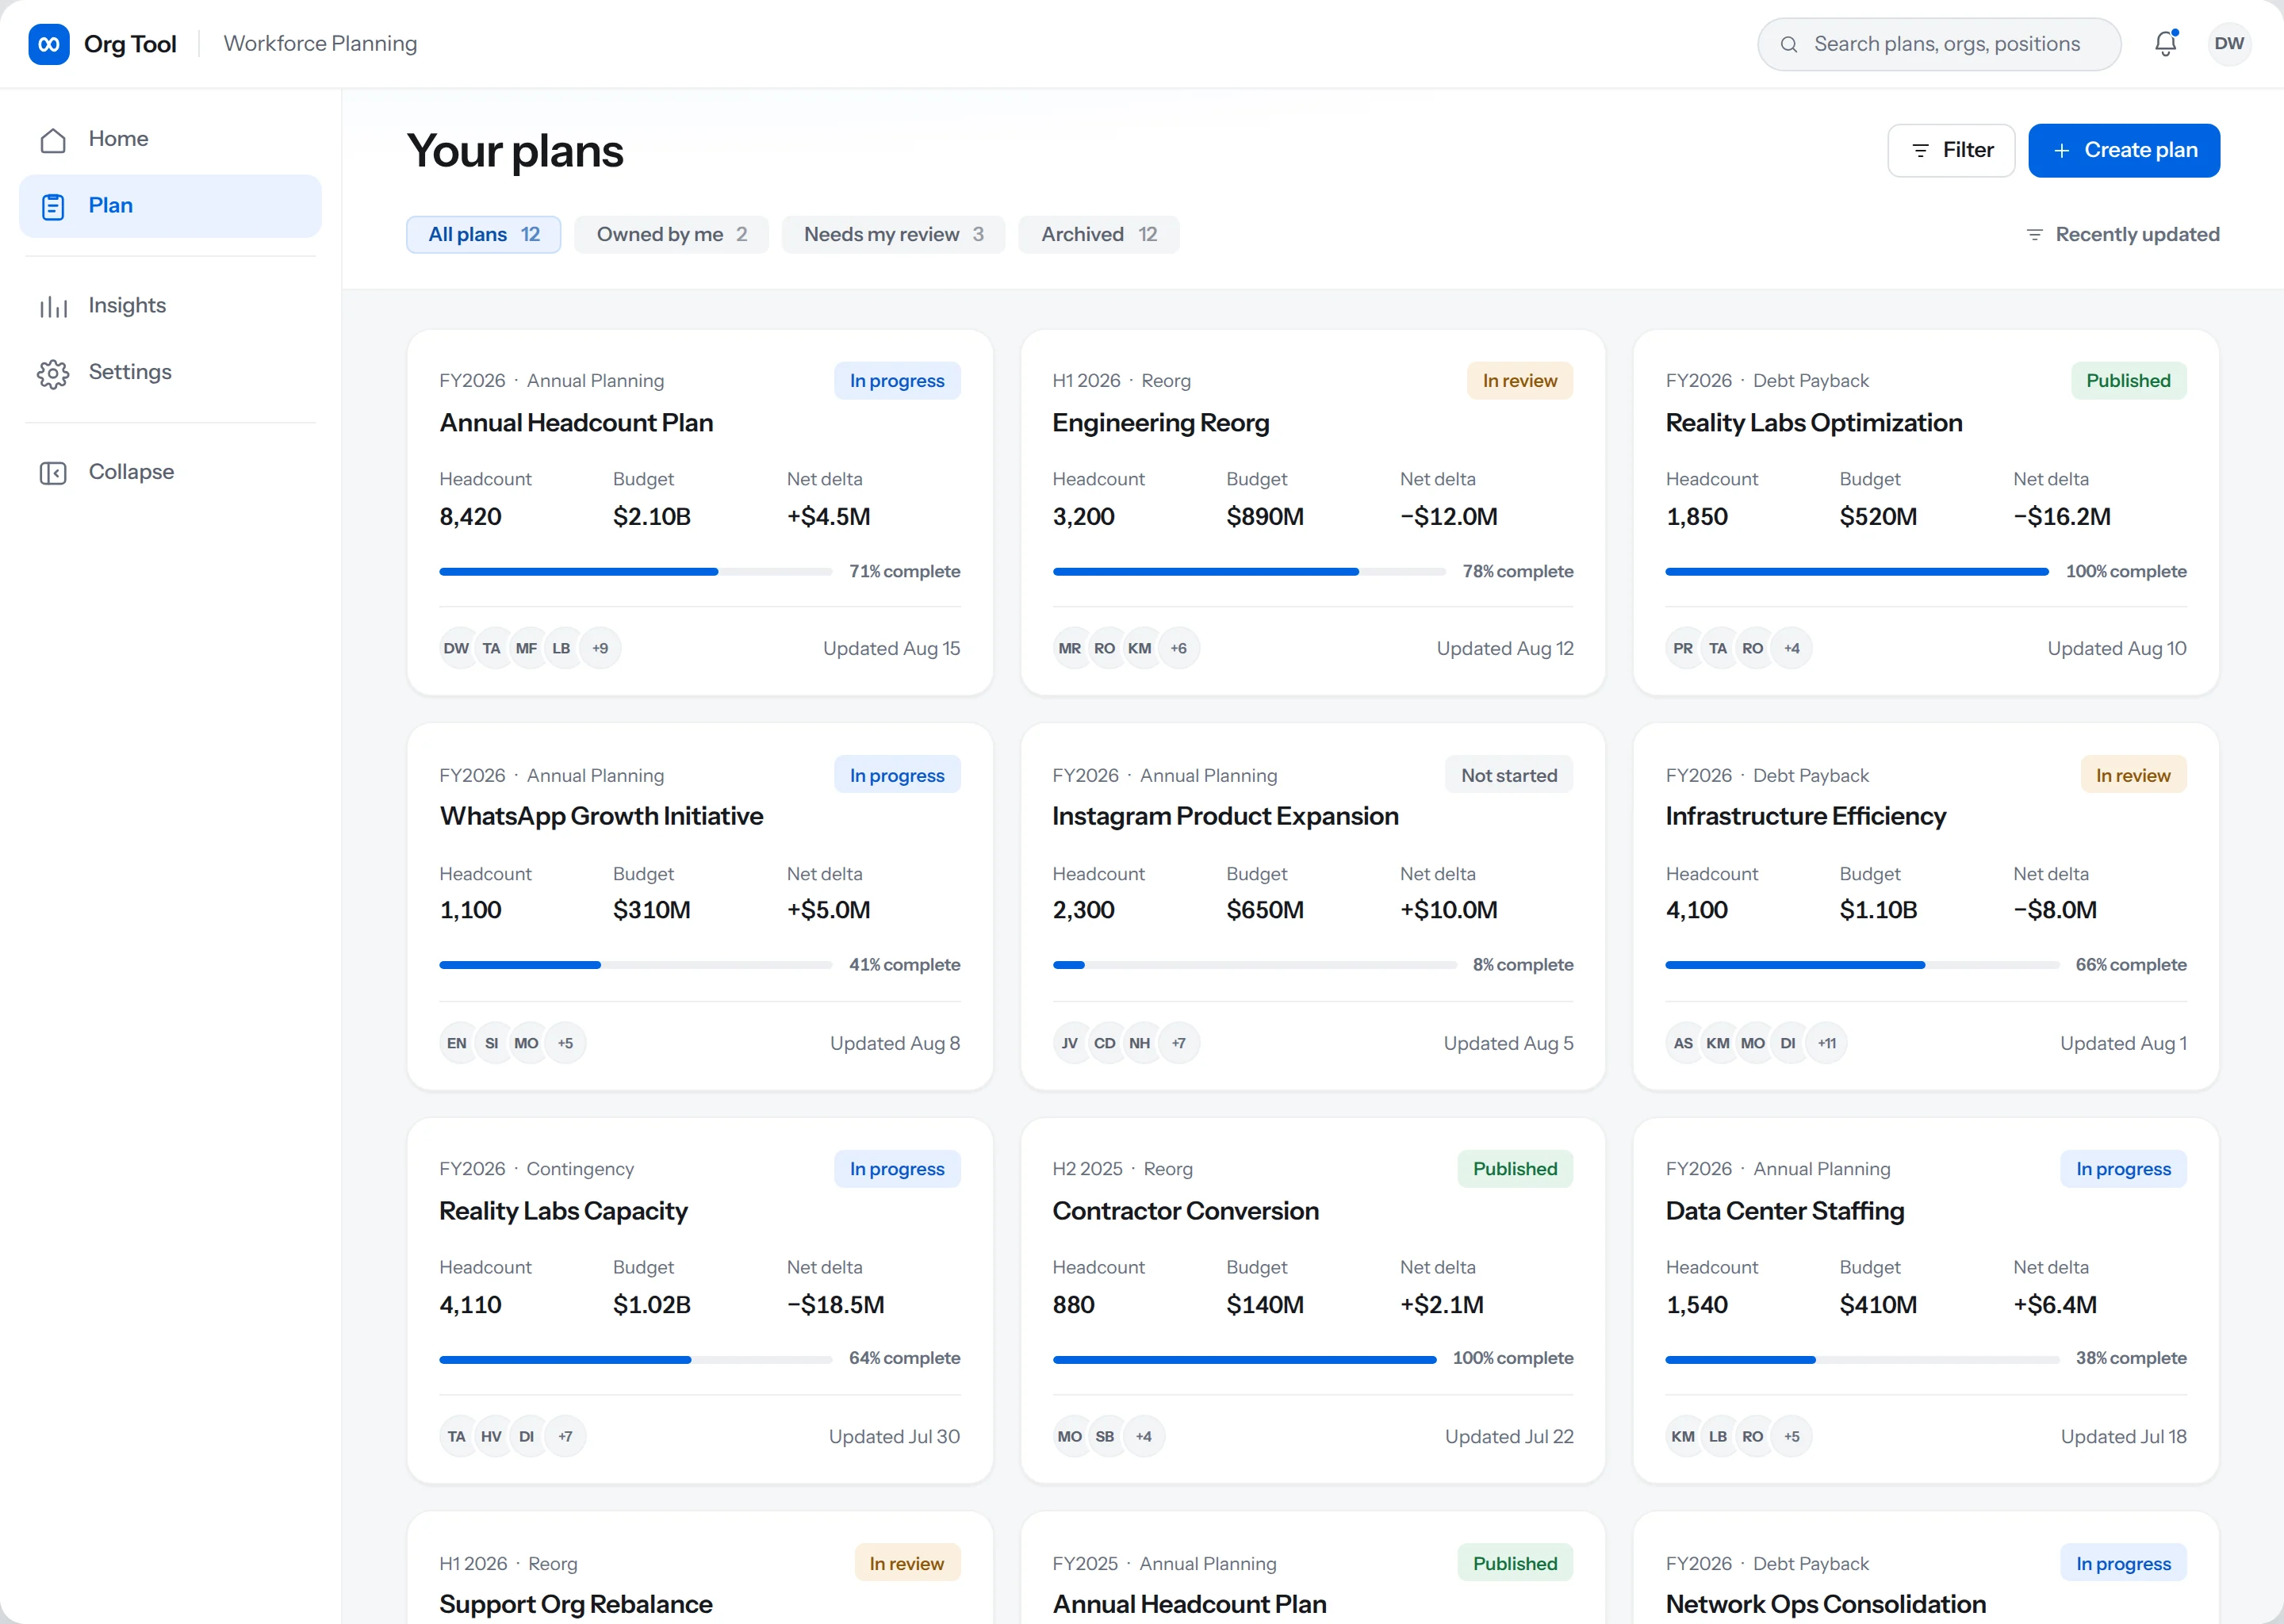
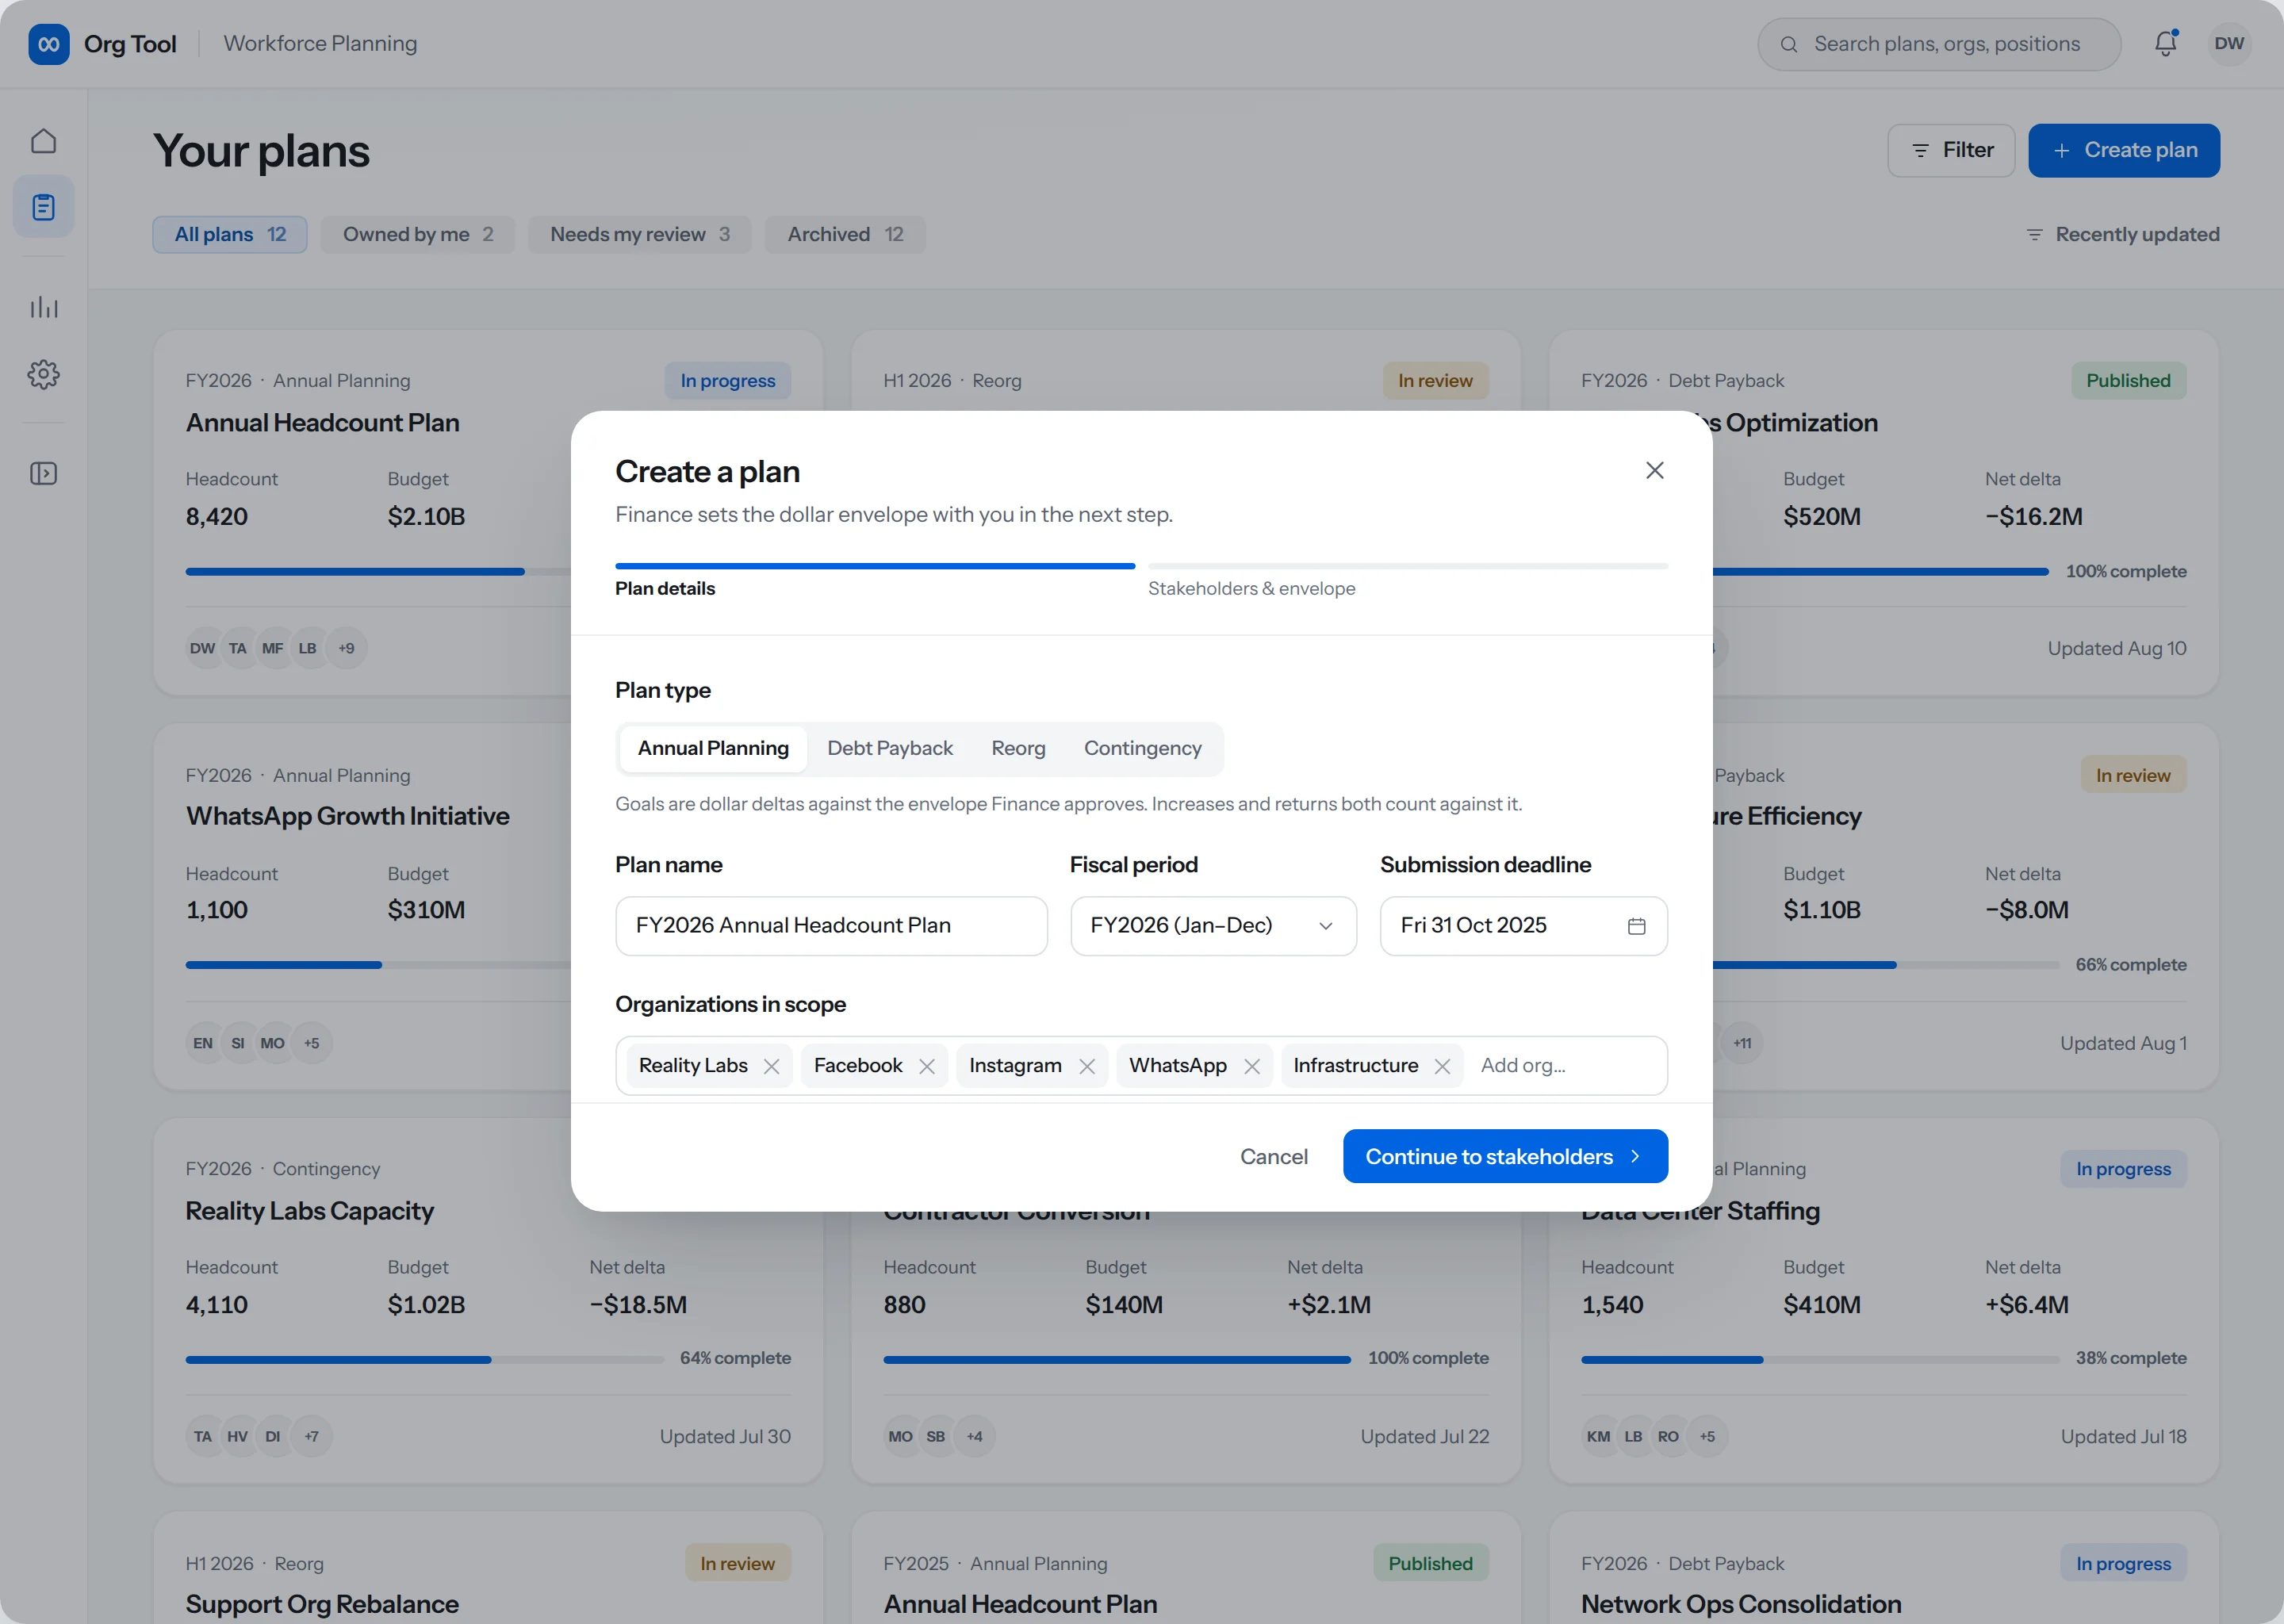
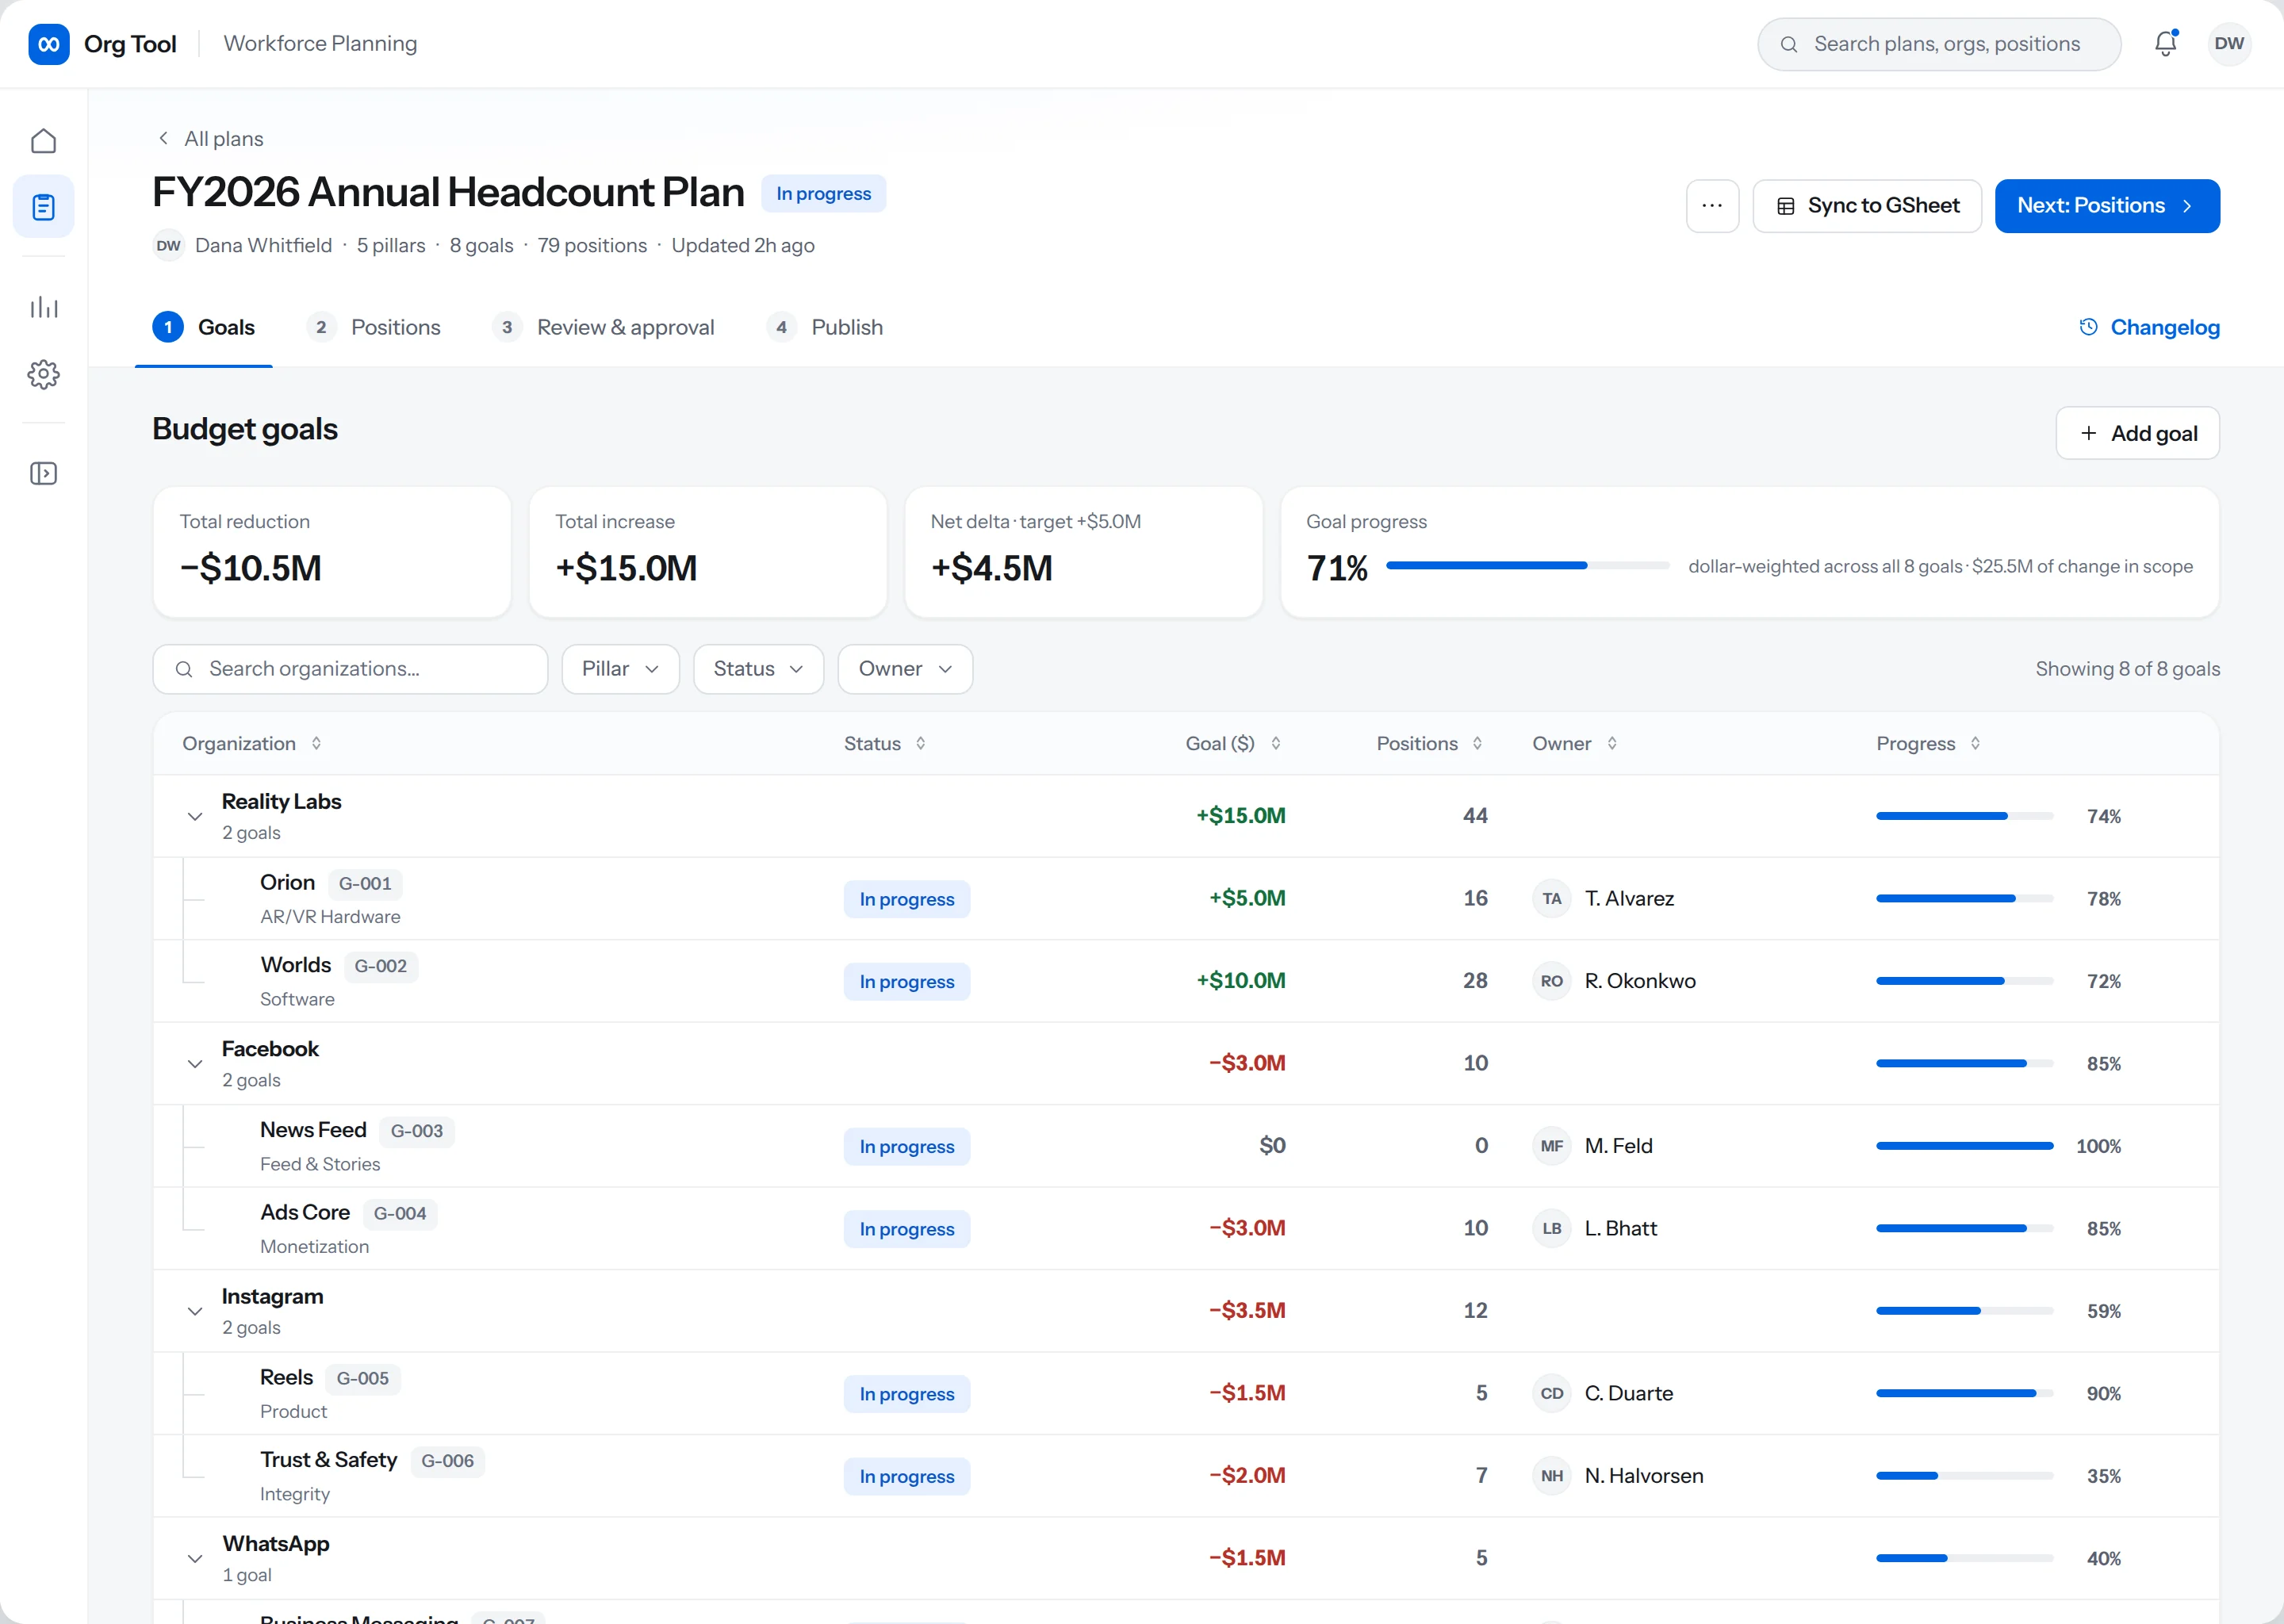
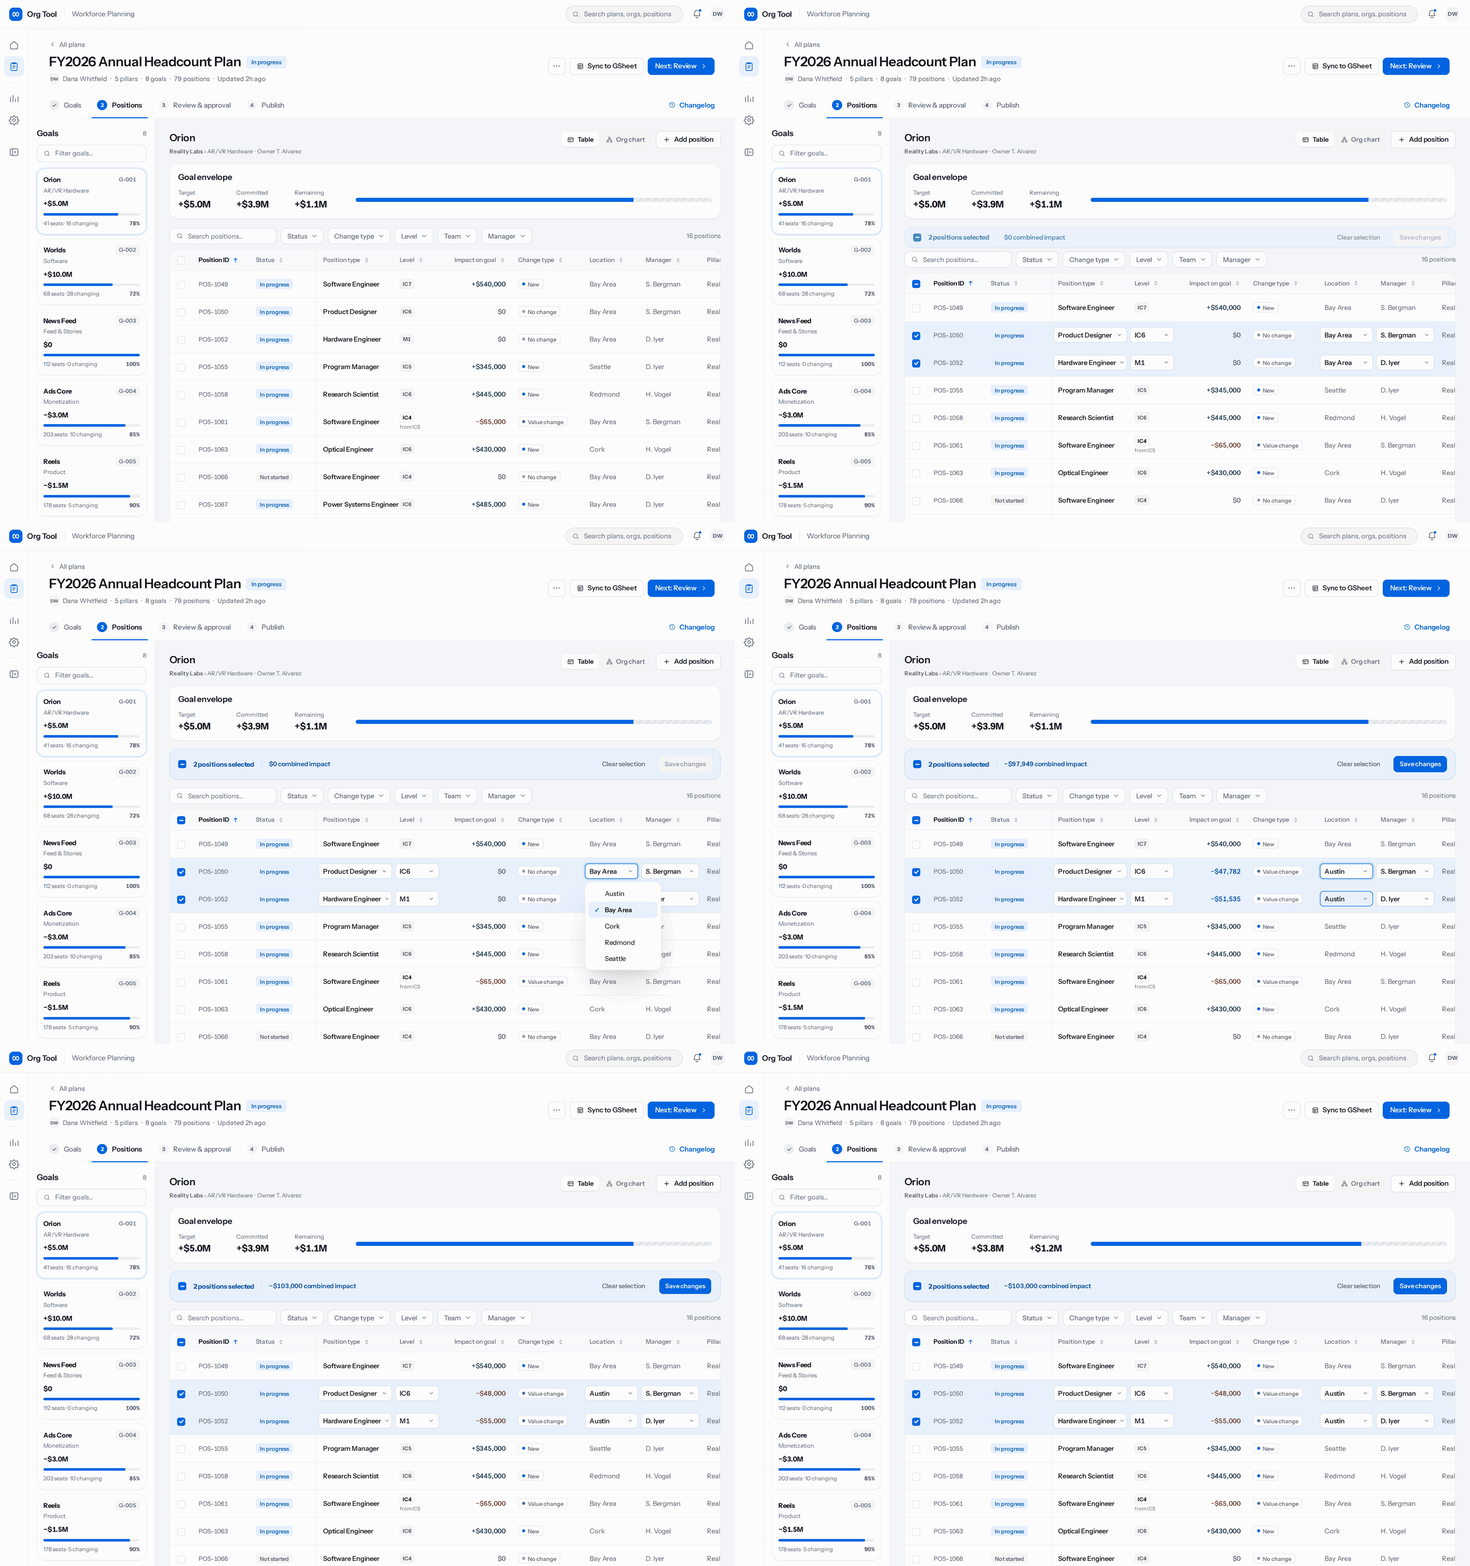
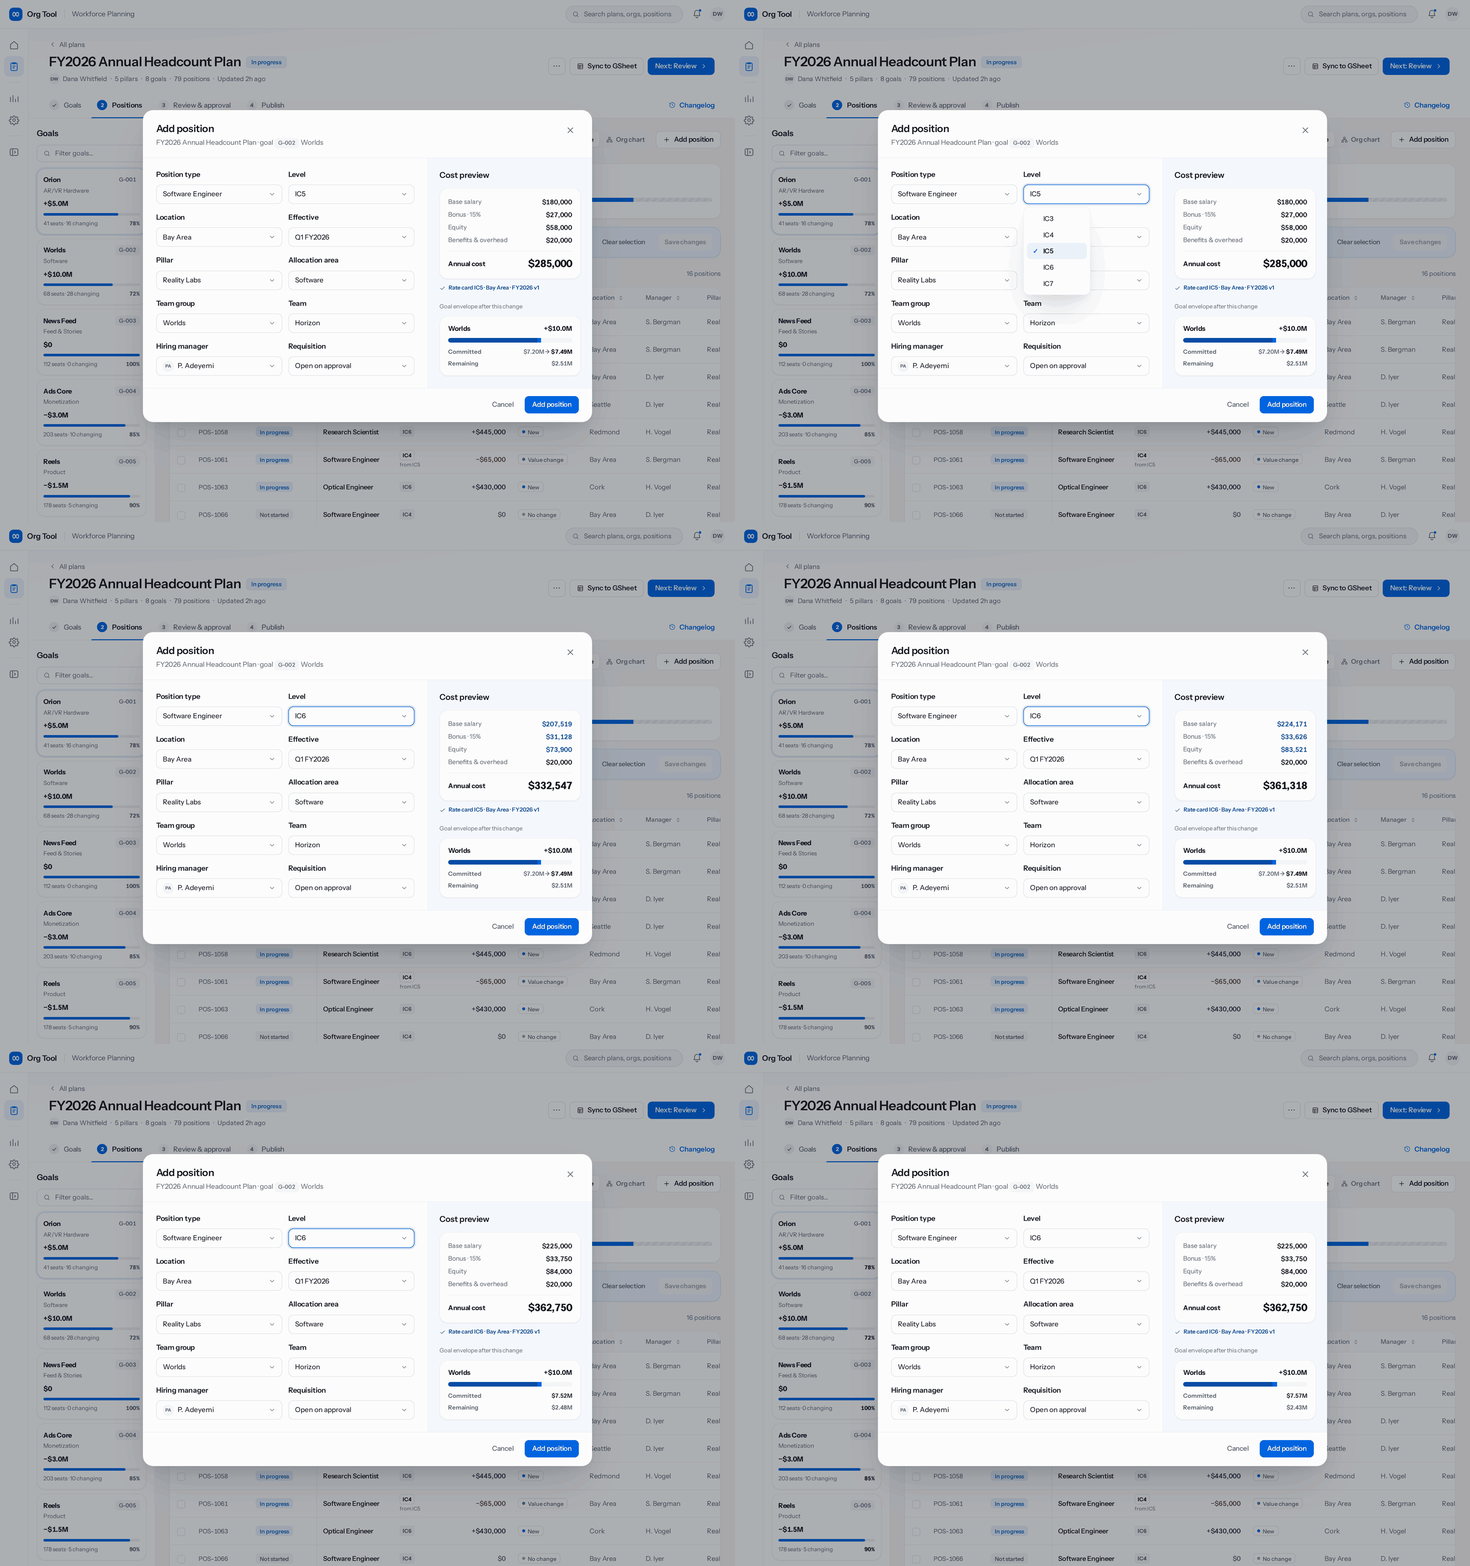
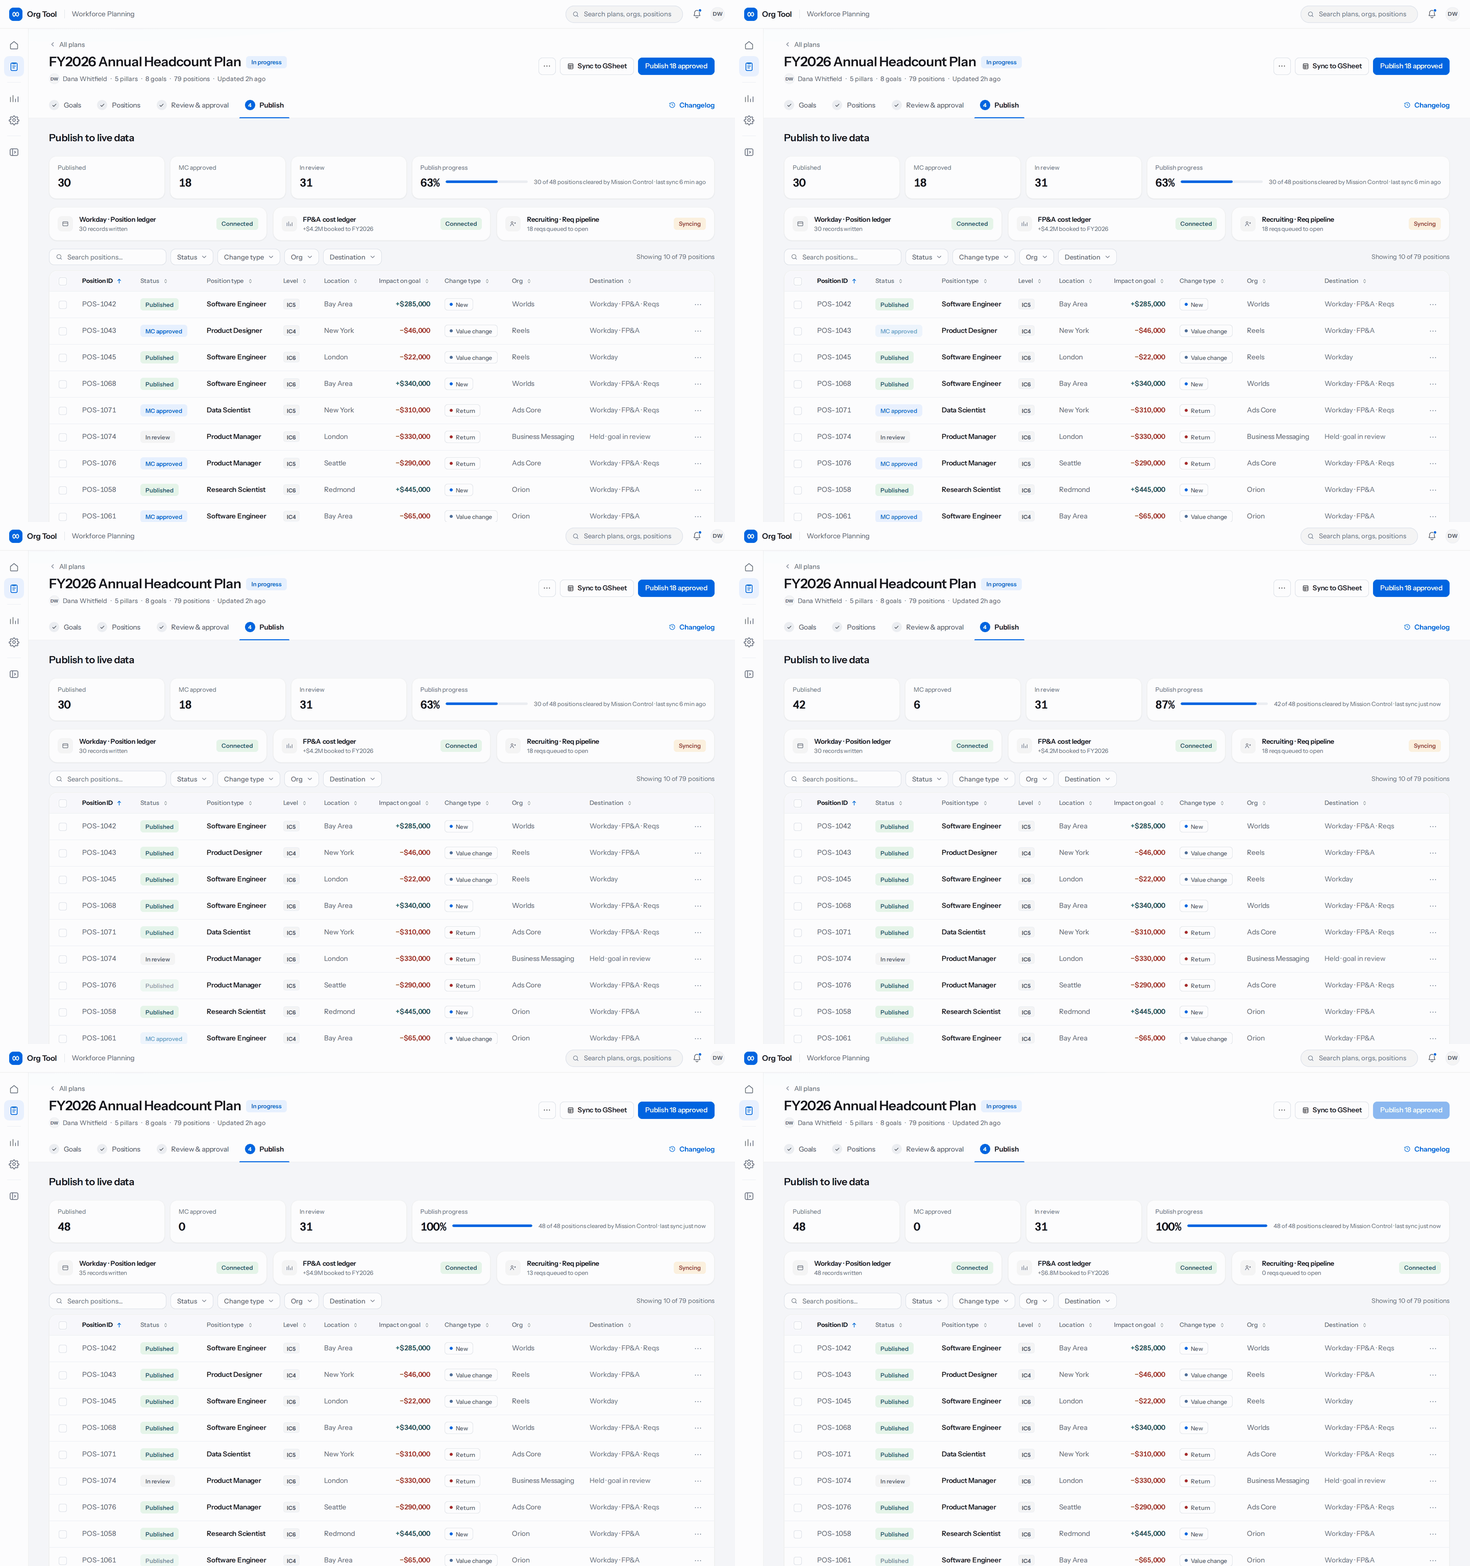
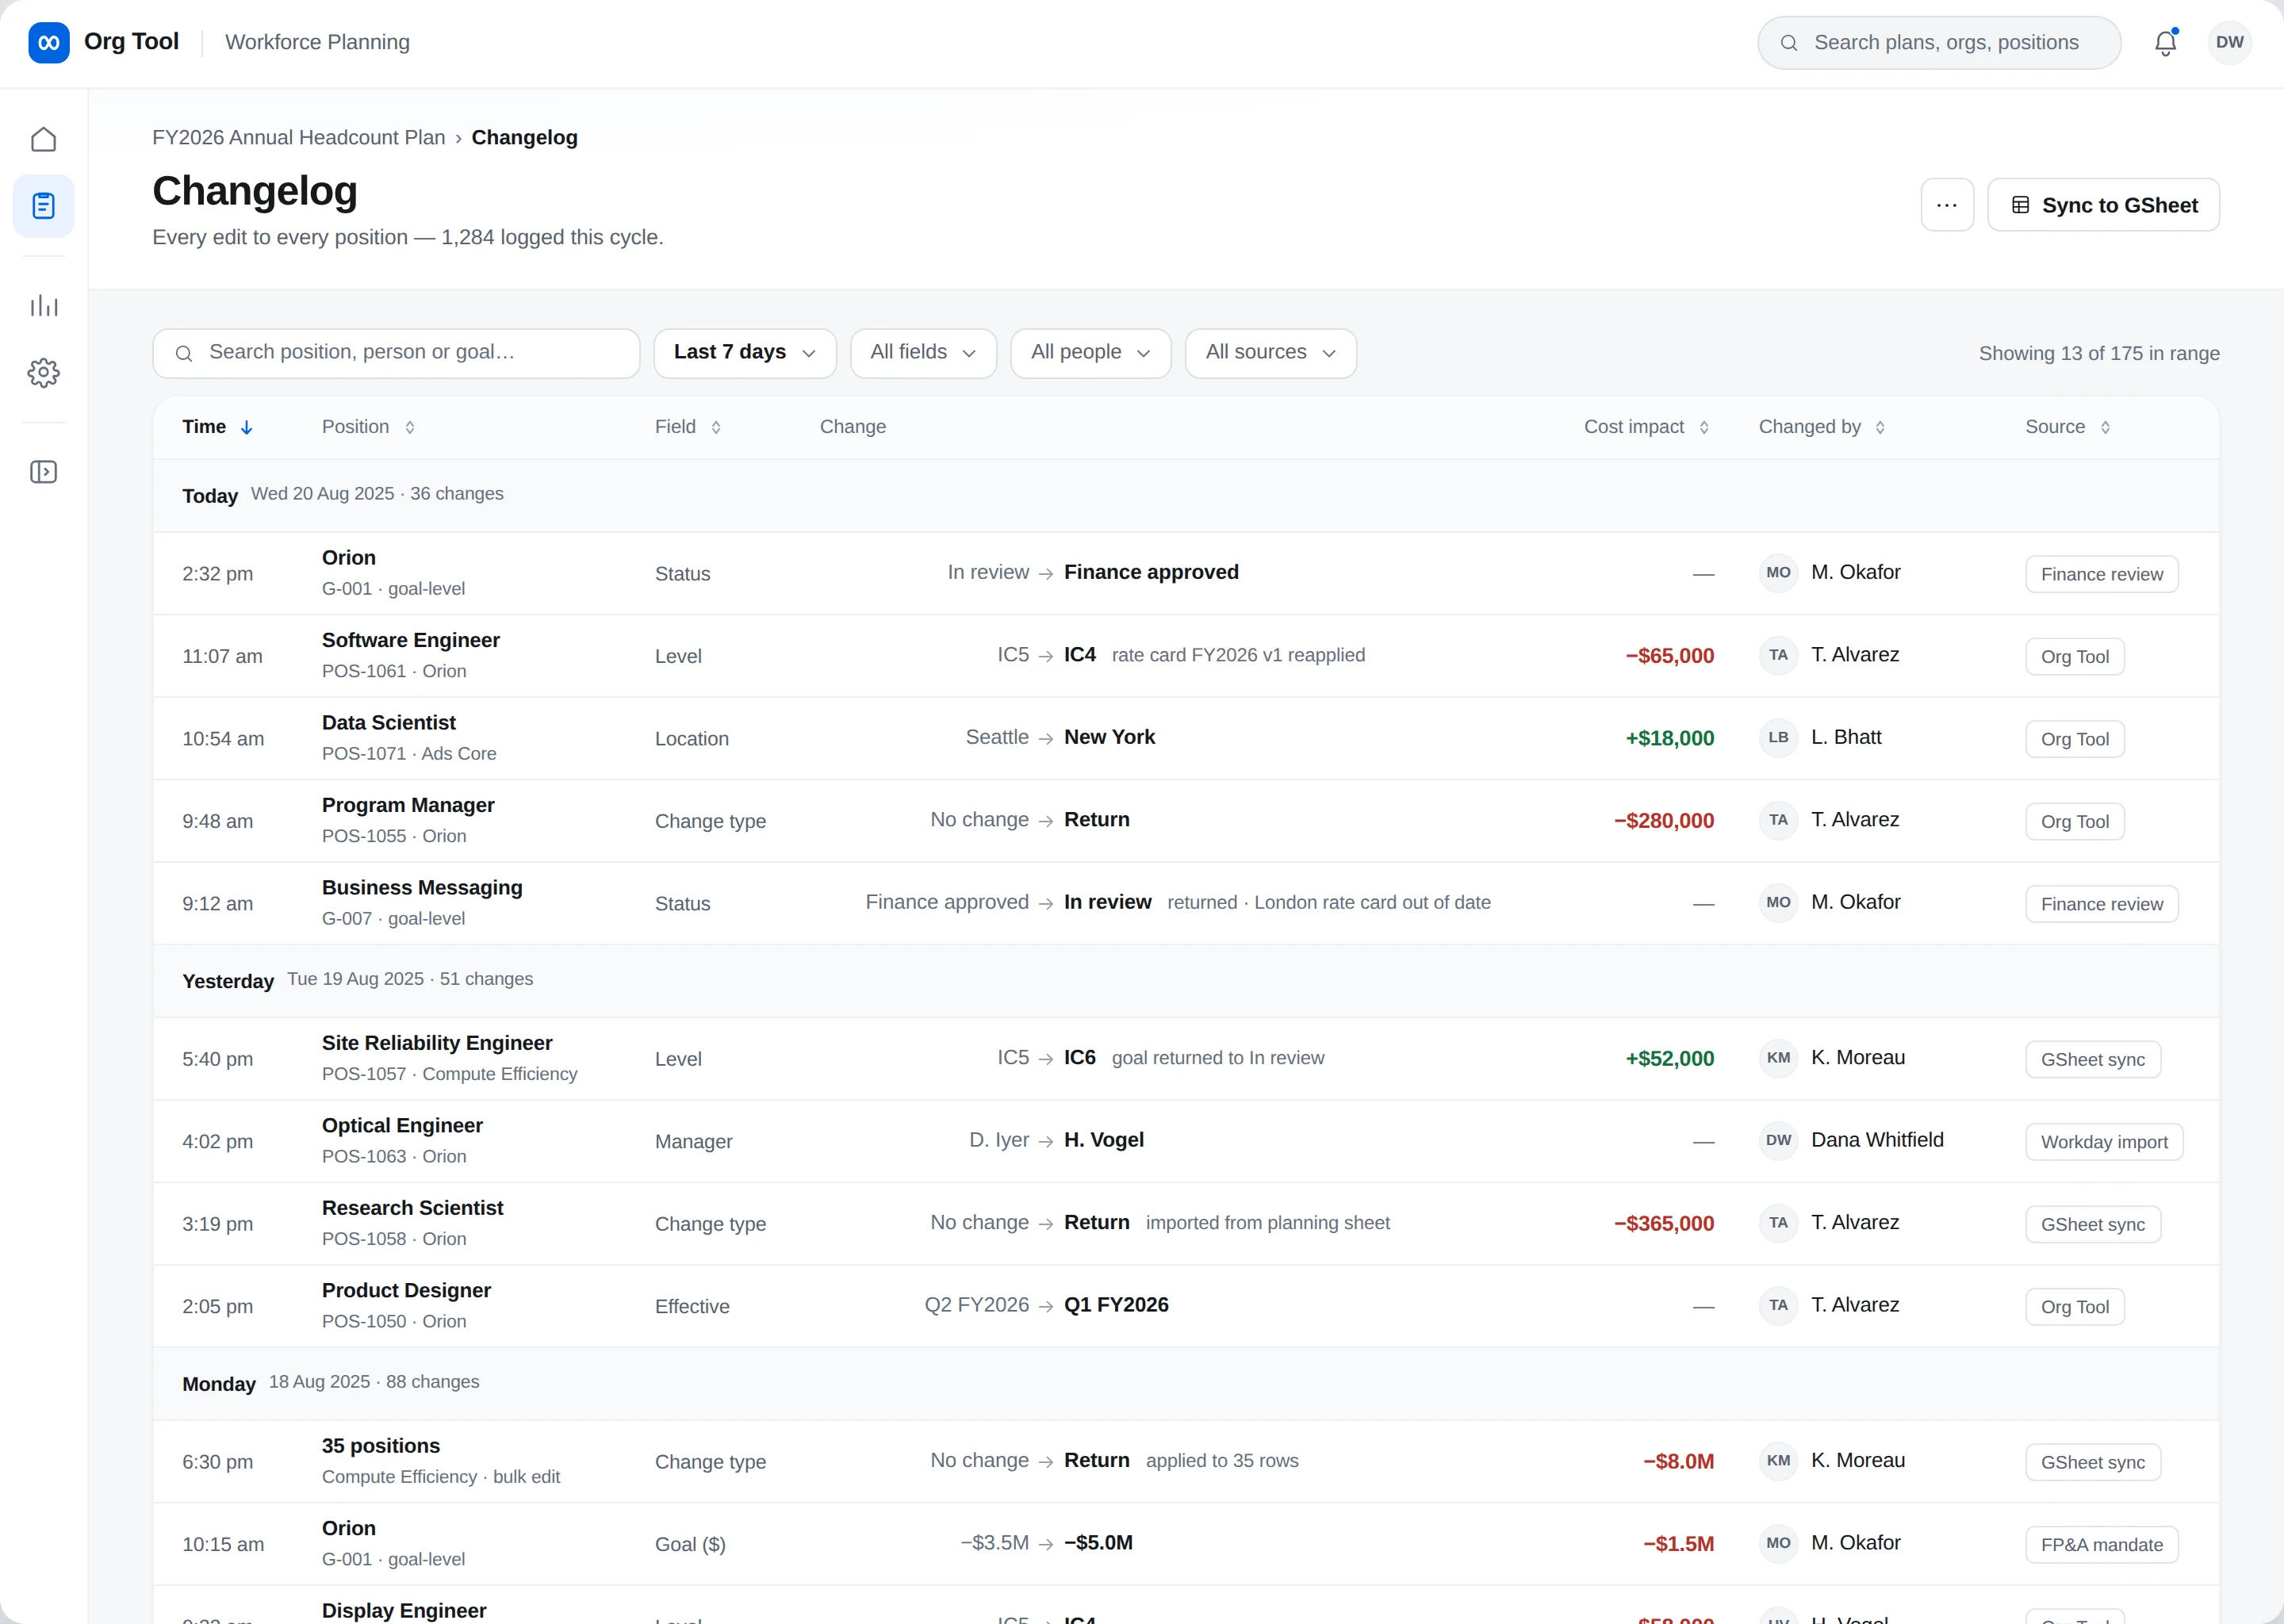
The screens below follow a single Headcount Annual Budget Planning cycle end to end, from scoping the plan through review, publish, and audit. Three mechanics run underneath all of it:
 Illustrative data
 Illustrative data
 Illustrative data
 Illustrative data
 Illustrative data
 Illustrative data
 Illustrative data
 Illustrative data
 Illustrative data
 Illustrative data
 Illustrative data
 Illustrative data
 Illustrative data
Because annual planning timelines were extremely tight, formal usability testing and validation were primarily conducted during the Reorg project. Testing surfaced a key gap: users lacked clarity on process stages. I redesigned the flow into clear, stepped stages so people always knew what phase they were in.
Post-launch research surfaced two structural tensions, each with a fix already planned:
Driving alignment between the product team and stakeholders, and being part of strategy. Deeply understanding the business problems and how they affect the company. Documenting user journeys and connecting them to the design solution before design is finalized.
Do research earlier and more often. Create more catered experiences for how an org leader plans versus Finance and Mission Control. If I were still on this project today, I would use AI to make the process more efficient and more personalized.
Complex enterprise spaces require designing for the organization just as much as the interface. Leading workforce planning at Meta reinforced that structural success comes from operating across the entire product lifecycle: bridging the gap between Finance's spreadsheets, HR's workflows, and leadership's goals. True design leadership at this scale means translating institutional complexity into a cohesive system that aligns an entire company.